BTC is potential of having a trend reversal
BTC price line started descending after touching 69k at 10th of November 2021. Despite of the struggles made by bulls, the support levels were broken easily; At the moment the price line on BTC chart is almost at its lowest in 2022, as some indicators suggest, the price line is potential of going through an ascending wave.
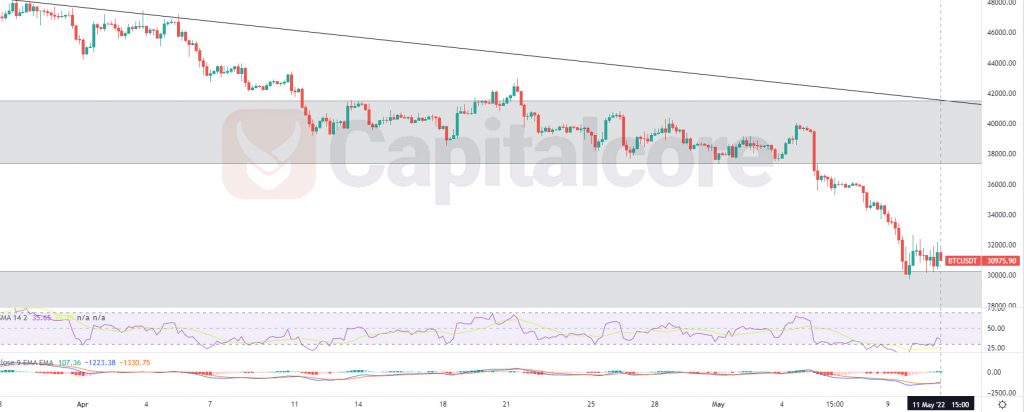
Chart Notes:
• Chart time-zone is UTC (+03:00)
• Candles’ time-frame is 4h.
The price line at the moment is almost on 30975, which would be just above the support level at 30k. The Black line on the chart indicates the descending line which has formed the current bearish trend. The gray areas show the levels at almost 30 and 40k which are considered as important zones for BTC. RSI is almost in the Over selling zone and is issuing positive divergence signal; MACD is also showing potential for an ascending wave. Traders can be waiting for the price line to touch the support zone once more and then, on witnessing any bullish triggers, they can enter long positions. Bulls can target 38500 and 43300.
Please note that the validity of this analysis would highly decrees if the price line breaks below 27700.
• DISCLAIMER: Please note that the above analysis is not an investment suggestion by “Capitalcore Ltd”. This post has been published only for educational purposes.