>Bearish Price Prediction for the Fiber
The EURUSD forex pair today is hovering around a significant resistance zone, indicating potential bearish movements in the near term. Analysing the technical indicators on this pair suggest a possible downturn as the price line maintains a considerable distance from the Ichimoku Cloud, signaling overbought conditions. The RSI indicator analysis is revealing negative divergence while remaining above the 70 level, reinforcing the overbought status and hinting at an impending bearish phase. Also, the recent candlestick patterns on this pair, the fiber, display bearish characteristics, adding to the likelihood of a price decline. Traders should be cautious and consider the fiber’s chart trading signals when making trading decisions.
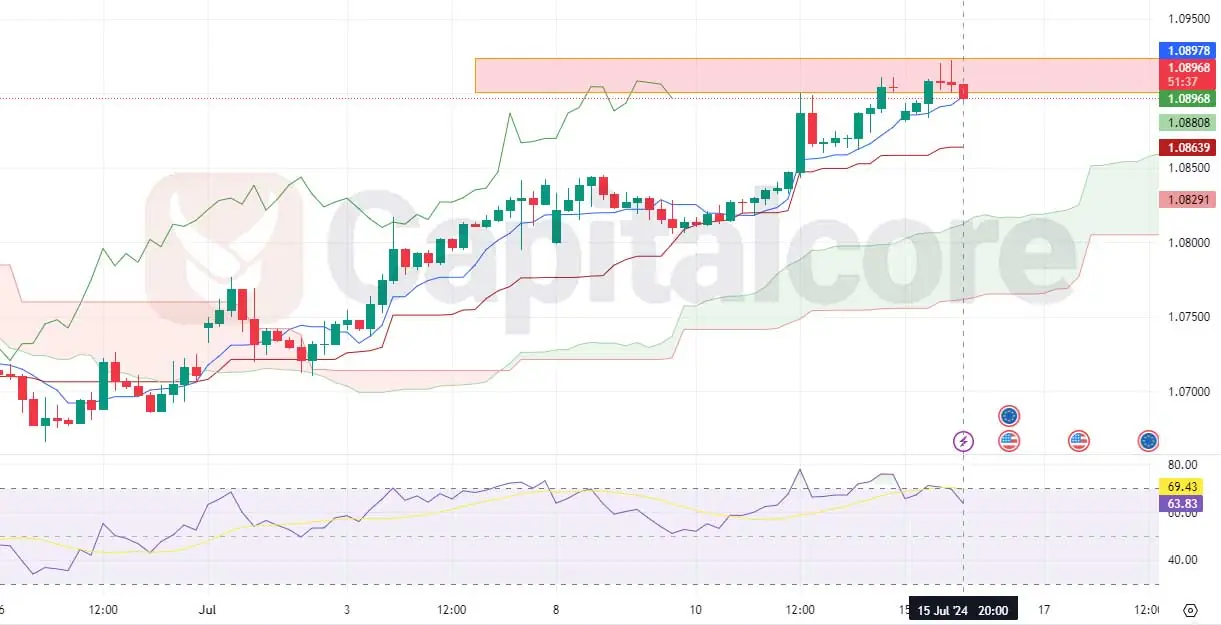
Chart Notes:
• Chart time-zone is UTC (+03:00)
• Candles’ time-frame is 4h.
In addition to the technical outlook, fundamental factors are poised to influence EURUSD movements. Key economic data releases are scheduled, including the Italian Trade Balance, the Eurozone Trade Balance, and the ZEW Economic Sentiment for both the Eurozone and Germany. The forecasts indicate potential declines compared to previous figures, suggesting weaker economic sentiment and trade performance in the Eurozone. If the actual data aligns with or falls below these forecasts, it could exert additional downward pressure on the EURUSD, amplifying the bearish sentiment observed in the technical analysis.
Traders should monitor these economic releases on EUR and USD currencies closely as they can significantly impact the EURUSD price action, potentially validating the bearish predictions derived from the current technical indicators.
• DISCLAIMER: Please note that the above analysis is not an investment suggestion by “Capitalcore Ltd”. This post has been published only for educational purposes.