- August 1, 2024
- Posted By: james w
- Category: Market News
Analyzing EUR/USD H4: Bollinger Bands, MACD, and Fibonacci Insights
The EUR/USD forex pair, commonly known as the “Fiber,” is one of the most traded currency pairs in the world, representing the exchange rate between the Euro and the US Dollar. Traders closely monitor this pair for insights into global economic health and monetary policy directions. Today’s EUR/USD outlook is influenced by several low-impact economic indicators from the Eurozone, including the Spanish, Italian, French, and German Manufacturing PMIs. The Spanish PMI is forecasted at 52.5, suggesting industry expansion, while the Italian, French, and German PMIs are expected to remain below the 50 mark, indicating contraction. Additionally, the ECB Economic Bulletin will provide insights into the central bank’s economic assessments. On the USD side, key data such as Unemployment Claims, with a forecast of 236K, and the ISM Manufacturing PMI, expected at 48.8, will be crucial as they reflect the health of the labor market and manufacturing sector in the US.

Chart Notes:
• Chart time-zone is UTC (+03:00)
• Candles’ time-frame is 4h.
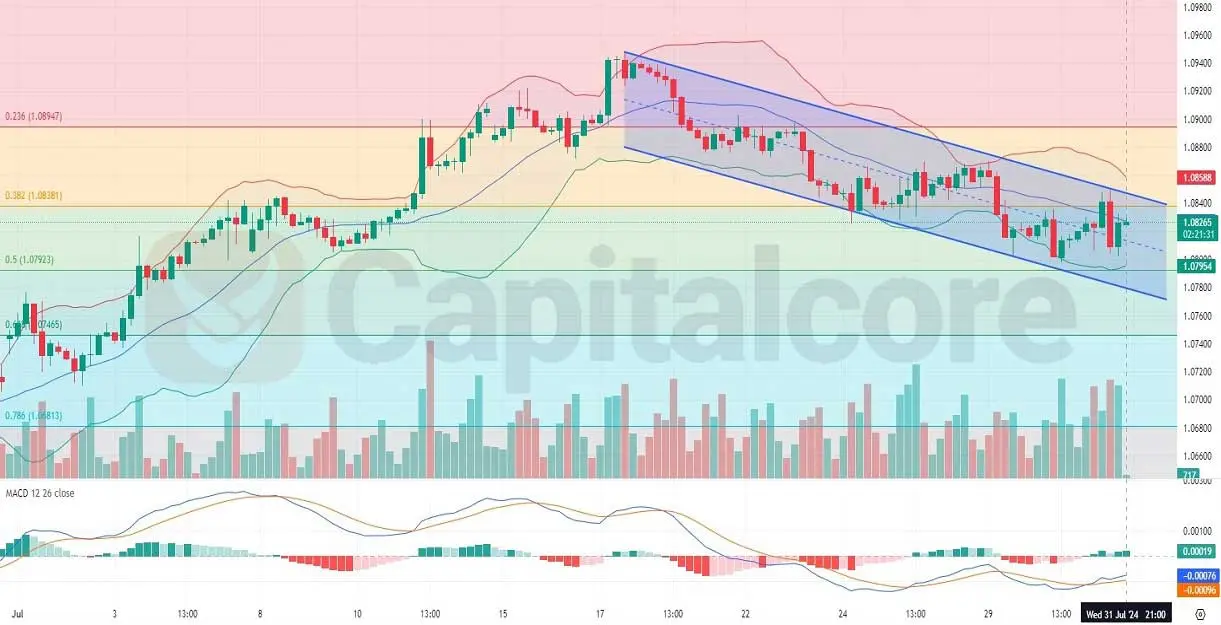
Analyzing the EUR/USD H4 chart, the pair is currently in a bearish trend, trading within a descending channel. The Bollinger Bands indicate increased volatility as they have widened slightly over the past few days. The price recently moved from the lower Bollinger Band towards the middle band but faced resistance and retreated. However, the last two candles have been bullish, attempting to breach the middle band again. The MACD indicator shows that the MACD line and the signal line are below the zero line, indicating bearish momentum, but the histogram shows diminishing bearish momentum, suggesting a possible reversal or consolidation. The Fibonacci retracement levels indicate that the price is hovering around the 0.5 level, providing significant support and resistance zones. The volume bars show increased activity during the price drops, indicating strong selling pressure. In summary, while the pair is in a bearish trend, recent bullish candles and diminishing bearish momentum in the MACD histogram suggest potential consolidation or a minor bullish correction before resuming the downward trend.
• DISCLAIMER: Please note that the above analysis is not an investment suggestion by “Capitalcore LLC”. This post has been published only for educational purposes.