Gold Price Surges to New All-Time High
Gold prices have recently achieved a new all-time high (ATH) on the daily chart, surpassing the key resistance level of around $2,480. This breakout signals strong bullish momentum in the market, as confirmed by the previous daily candle, which closed as a bullish hammer—a classic reversal pattern indicating potential continuation of the upward trend. Traders and investors watching XAU/USD (the symbol for gold in the forex market) will likely see this as a signal for further gains. With the RSI nearing 65, the momentum appears to be in favor of the bulls, suggesting that the current rally could extend further.
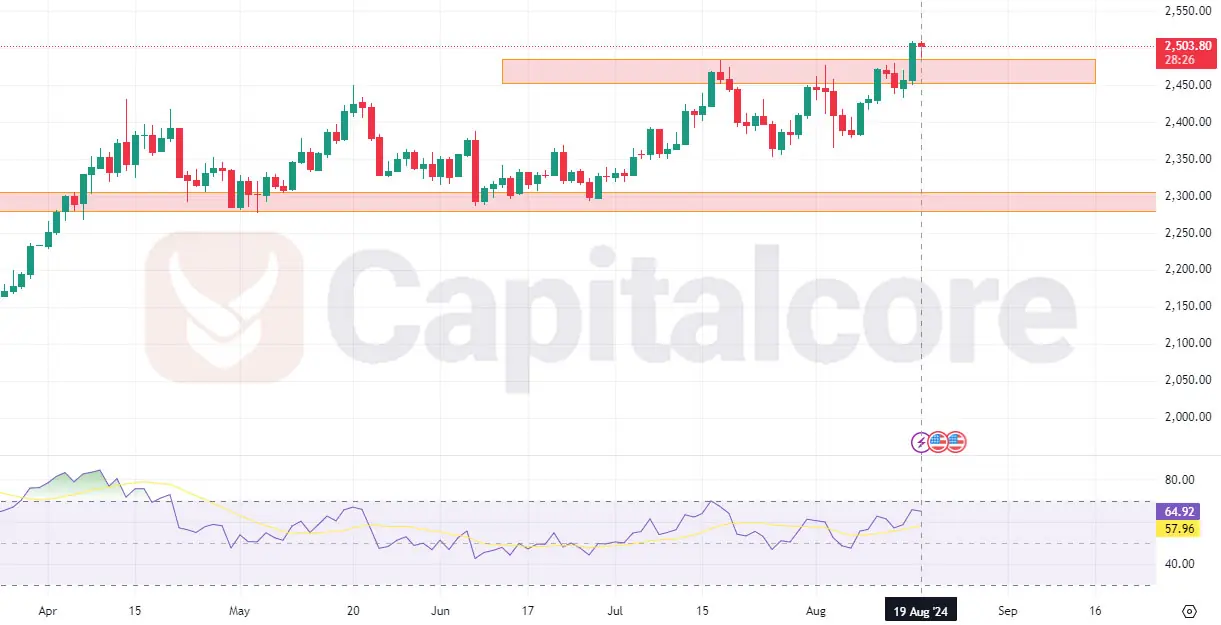
Chart Notes:
• Chart time-zone is UTC (+03:00)
• Candles’ time-frame is 4h.
For those seeking up-to-date gold price analysis and XAU/USD daily analysis, it’s crucial to note that gold’s bullish trajectory is supported by technical indicators and recent price action. The RSI’s positioning in bullish territory supports the view that the upward wave in gold prices may continue. This surge in XAU/USD aligns with global market dynamics that favor safe-haven assets, especially as gold continues to attract attention amidst economic uncertainties. Traders should closely monitor the $2,500 level as the next psychological target, as breaking this could lead to even more significant gains. Stay tuned to this space for the latest insights and forecasts on gold prices and market movements.
DISCLAIMER: Please note that the above analysis is not an investment suggestion by “Capitalcore LLC”. This post has been published only for educational purposes.: Please note that the above analysis is not an investment suggestion by “Capitalcore LLC”. This post has been published only for educational purposes.