EUR/USD Bollinger Bands and Fibonacci Retracement Insight
The EURUSD forex pair, often referred to by its nickname “Fiber,” represents the trading relationship between the Euro and the U.S. Dollar, the two most traded currencies globally. This currency pair is heavily influenced by macroeconomic factors from both the Eurozone and the United States, making it a favorite among traders for its high liquidity and volatility. The upcoming release of Purchasing Managers’ Index (PMI) data from the Eurozone today and the economic outlook discussion by key Federal Reserve members in the U.S. are likely to influence market sentiment and drive volatility in the pair.
The upcoming S&P Global PMI data for both manufacturing and services in the Eurozone is critical, as values above 50 indicate expansion, boosting the Euro, while values below 50 suggest contraction, leading to potential weakness. Similarly, speeches from Federal Reserve officials such as Raphael Bostic and Austan Goolsbee could hint at future monetary policy directions, especially if hawkish tones are observed, which would strengthen the U.S. Dollar. If the Euro PMI surprises to the upside, it could help push EUR USD price higher; conversely, stronger-than-expected comments from Fed officials might weigh on the Euro.
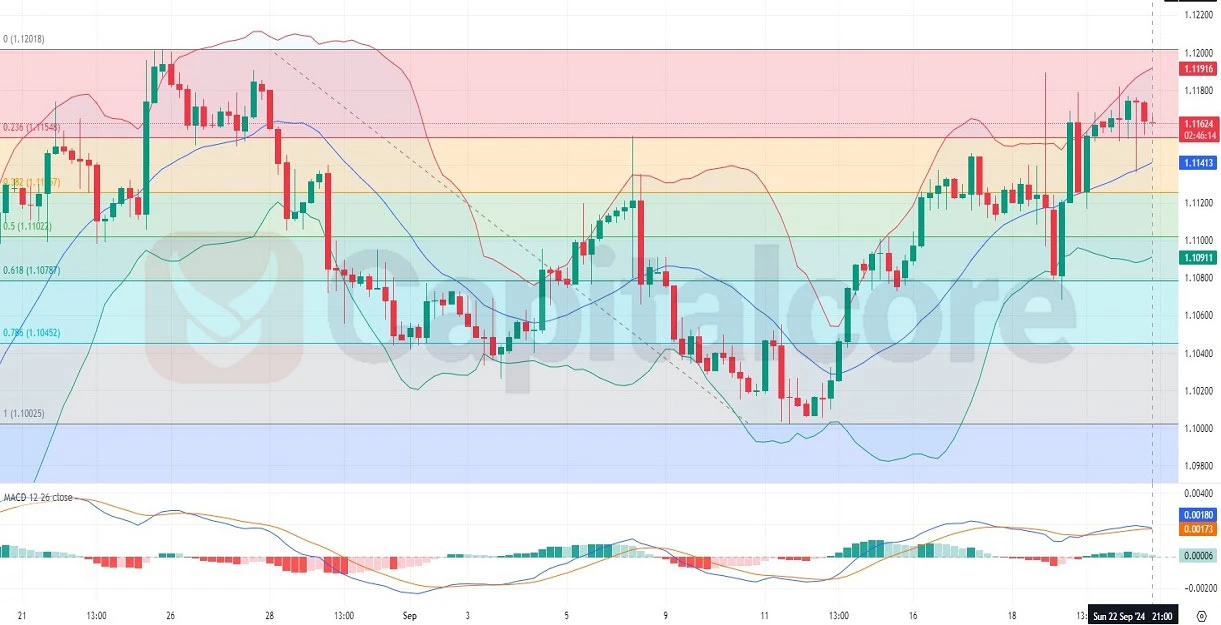
Chart Notes:
• Chart time-zone is UTC (+03:00)
• Candles’ time-frame is 4h.
In the H4 chart of EUR/USD, the pair has been in an upward trend recently, trading within the upper half of the Bollinger Bands. While the price touched the upper band, it has pulled back slightly over the last few candles, with the most recent candle being bearish. The price is currently hovering between the middle and upper Bollinger Bands, indicating that the pair may still maintain its bullish bias as long as it remains above the middle band. Moreover, the price is oscillating between the 0 and 0.236 Fibonacci retracement levels, suggesting a consolidation phase after recent gains.
The MACD indicator shows a weakening bullish momentum, with the histogram declining and the MACD lines appearing close to a potential bearish crossover. This could indicate short-term bearish pressure. However, as long as the price holds above key Fibonacci support levels, particularly around the 0.236 retracement, the bullish outlook might still prevail. Traders should closely monitor a potential breakout or breakdown of these levels to gauge the next significant price movement.
• DISCLAIMER: Please note that the above analysis is not an investment suggestion by “Capitalcore LLC”. This post has been published only for educational purposes.