- September 30, 2024
- Posted By: james w
- Category: Market News
EURUSD Import Price Index and CPI Fundamental Impact
The EUR/USD forex pair, often referred to as “Fiber,” is the most traded currency pair globally, representing the exchange rate between the Euro (EUR) and the US Dollar (USD). The pair’s performance is highly influenced by economic releases and geopolitical factors from the Eurozone and the United States, making it a key indicator for global market trends. With a multitude of events set to impact the pair today, traders are closely monitoring both European and U.S. developments, such as inflation data and central bank remarks, to gauge future price movements.
Today’s EUR USD outlook is shaped by several key factors. For the Euro, traders will focus on the Import Price Index and Consumer Price Index (CPI) reports from Germany and Italy, both critical indicators of inflation. If these metrics exceed forecasts, they would signal rising inflationary pressures, potentially prompting the ECB to take a more hawkish stance, boosting the Euro. Furthermore, ECB President Christine Lagarde’s speech could provide insights into future monetary policies, adding potential volatility to the Euro. On the U.S. side, Michelle Bowman’s and Jerome Powell’s speeches are pivotal as traders look for clues regarding future interest rate hikes. Any signs of hawkishness from Federal Reserve officials could strengthen the U.S. Dollar, especially if coupled with positive results from the Chicago PMI.

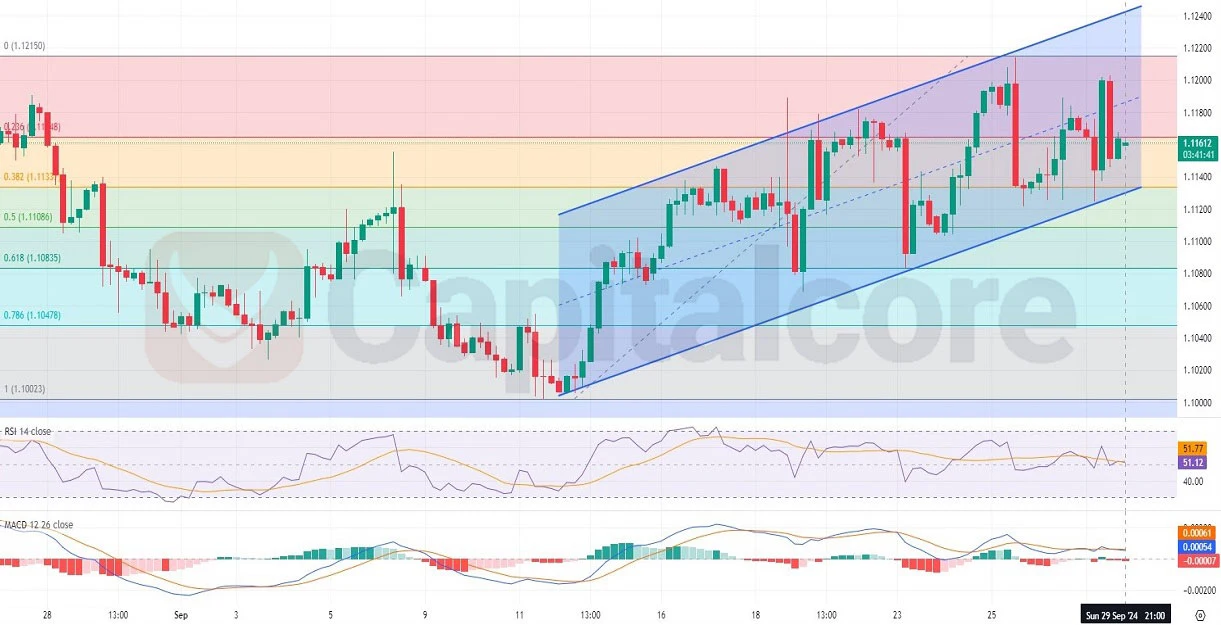
Chart Notes:
• Chart time-zone is UTC (+03:00)
• Candles’ time-frame is 4h.
The EUR/USD H4 chart reveals a bullish price trend channel, with several alternating bearish and bullish candles. Currently, the EUR USD pair is situated between the 0.382 and 0.236 Fibonacci retracement levels, suggesting ongoing upward momentum. The recent two green candles confirm bullish sentiment, and the price is close to breaking above the 0.236 Fibonacci level, which if successfully breached, could lead the price toward the 0.0 Fibonacci level near 1.12150. The RSI hovers slightly above 50, suggesting a moderate bullish bias. Meanwhile, the MACD indicator shows flattening momentum, with the signal line close to crossing above the histogram, implying potential consolidation before a further upward move. Overall, the fiber’s technical indicators align with the view that a sustained move above 1.1180 could trigger further gains.
• DISCLAIMER: Please note that the above analysis is not an investment suggestion by “Capitalcore LLC”. This post has been published only for educational purposes.