USDJPY Technical Analysis: Steep Trend Angle and Price Action
The USD/JPY forex pair, commonly known as the “Gopher,” is one of the most actively traded pairs in the forex market, linking the U.S. dollar and the Japanese yen. It is highly sensitive to changes in U.S. monetary policy and Japanese economic data, making it a key indicator of the strength of the two largest economies. With the Federal Reserve expected to discuss potential hawkish adjustments in upcoming events today, including Federal Reserve Governor Michelle Bowman’s participation in the Independent Bankers Association of Texas Annual Convention and Neel Kashkari’s fireside chat, traders are keen to monitor any signals regarding future interest rate hikes. Increased hawkish sentiment could boost the USD, while dovish remarks could cause the USD/JPY pair to retract.
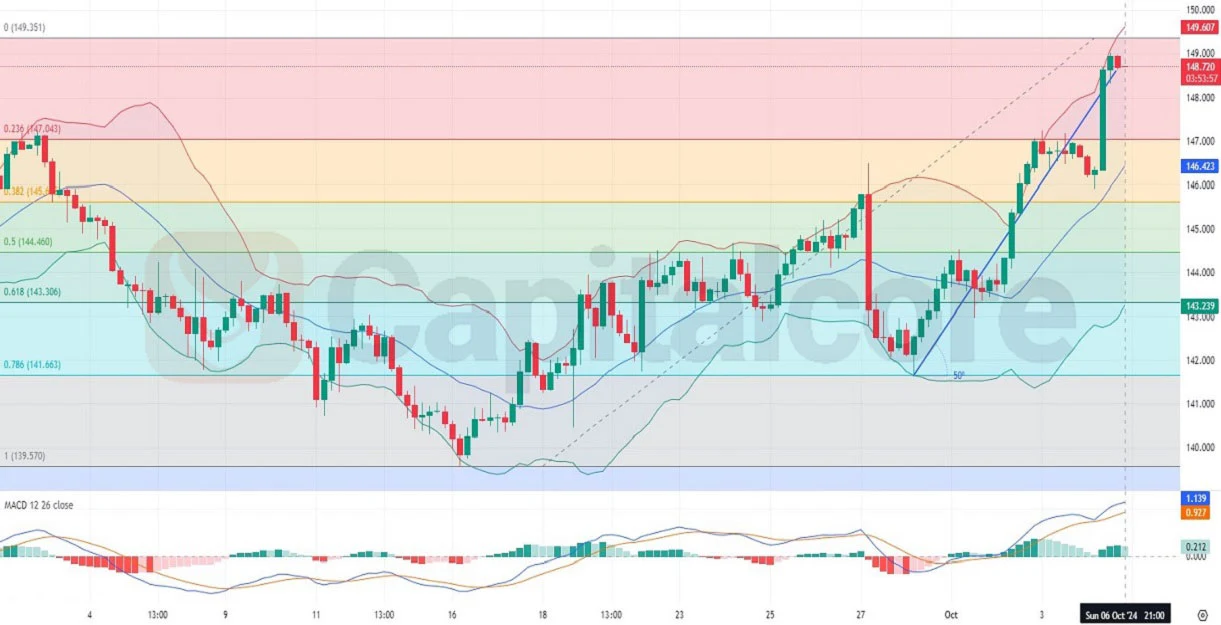
Chart Notes:
• Chart time-zone is UTC (+03:00)
• Candles’ time-frame is 4h.
On the technical side, the USD/JPY H4 chart shows strong bullish momentum as the price is positioned near the upper Bollinger band, indicating a sharp upward movement. The Bollinger bands have widened, signaling increased market volatility, while the price has been climbing at a steep 50-degree angle. The Fibonacci retracement levels highlight key areas of support and resistance, with the price trading between the 0 and 0.236 Fibonacci levels, suggesting that the price could be testing higher resistance. The MACD histogram also shows bullish sentiment, with a positive MACD line crossing, further reinforcing the upward momentum. However, traders should remain cautious for any possible corrections as the price approaches significant resistance levels.
DISCLAIMER: Please note that the above analysis is not an investment suggestion by “Capitalcore LLC”. This post has been published only for educational purposes.