Key technical indicators for GBPUSD trend analysis
The GBP/USD forex pair, also known as “Cable,” is one of the most traded currency pairs in the forex market, representing the British Pound against the US Dollar. Its movements are heavily influenced by economic data releases from both the UK and the US. Today, key UK economic events such as the Gross Domestic Product (GDP) release, construction output, and the trade balance are set to impact the British Pound. Similarly, the US PPI data and speeches from Federal Reserve members will likely drive market sentiment for the US Dollar. A stronger-than-expected UK GDP could offer short-term support for the Pound, while hawkish comments from the Federal Reserve could strengthen the Dollar and maintain downward pressure on GBPUSD chart.
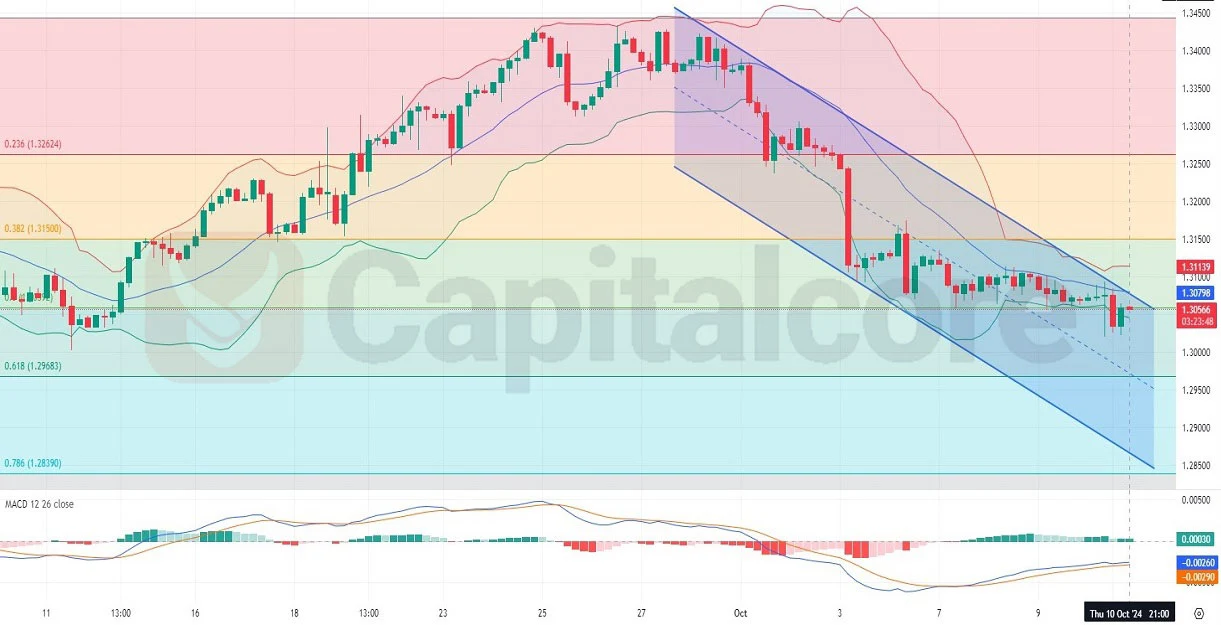
Chart Notes:
• Chart time-zone is UTC (+03:00)
• Candles’ time-frame is 4h.
On the GBP USD H4 chart, the price remains in a clear bearish trend, trading below the 50% Fibonacci retracement level, which suggests continued downside pressure. The Bollinger Bands have tightened, indicating lower volatility but hinting at a potential breakout. Price is primarily moving within the lower and middle bands, showing that it is struggling to regain upward momentum. Despite green bullish histogram candles from the MACD, the overall price movement is downward. The MACD line remains below the signal line, reinforcing the bearish outlook. With Cable’s price action nearing the 0.5 Fibonacci level, a further drop towards the 0.618 Fibonacci level could be expected unless bullish momentum builds up significantly.
DISCLAIMER: Please note that the above analysis is not an investment suggestion by “Capitalcore LLC”. This post has been published only for educational purposes.