EURUSD Below Ichimoku Cloud on H4 Chart
The EUR/USD currency pair, often referred to as the “Fiber,” is one of the most actively traded pairs in the forex market, representing the Eurozone’s economic strength versus the U.S. dollar. Today, several economic events, including the Consumer Price Index (CPI) reports and bond yields, will impact EUR/USD. If inflation in the Eurozone comes in higher than forecasted, it could support the euro due to expectations of tighter monetary policy from the European Central Bank (ECB). On the other hand, U.S. retail sales and jobless claims reports, along with Philadelphia Fed business data, will influence the U.S. dollar, with better-than-expected figures possibly boosting the dollar. These news releases are key drivers for today’s market sentiment and will significantly influence EUR/USD movements.
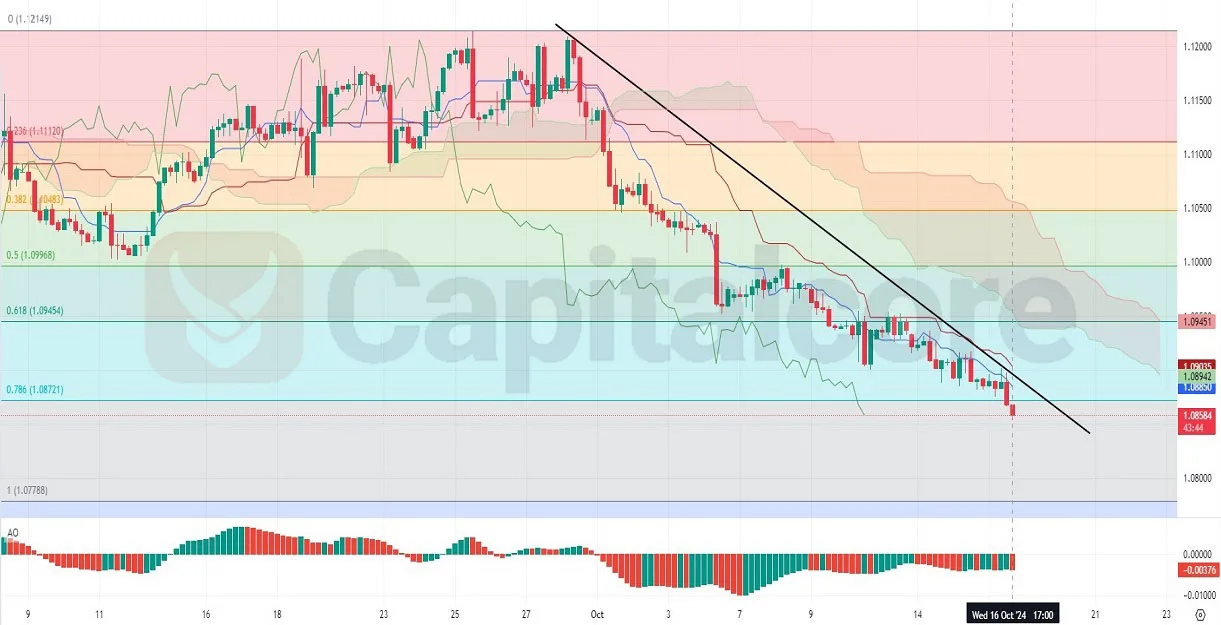
Chart Notes:
• Chart time-zone is UTC (+03:00)
• Candles’ time-frame is 4h.
From a technical standpoint, the EUR/USD H4 chart shows a clear bearish trend. The Ichimoku cloud indicates strong downward momentum, as the price is below the cloud, and the trendline drawn from previous highs suggests continued selling pressure. The Fibonacci Retracement Levels demonstrate that the price has recently touched the 0.786 level and is moving toward the 1.0 level, signaling a potential further decline if the support level breaks. The Awesome Oscillator (AO) reflects ongoing bearish momentum with no sign of reversal, with only three bullish candles appearing out of the last ten. As the price remains below key support levels and the cloud, sellers maintain control, and a break below the 0.786 Fibonacci level could open the path for further downside.
DISCLAIMER: Please note that the above analysis is not an investment suggestion by “Capitalcore LLC”. This post has been published only for educational purposes.