Potential Reversal or Continuation for AUD/USD
The AUD/USD pair, often referred to as the “Aussie,” represents the exchange rate of the Australian Dollar against the US Dollar. This forex pair is heavily influenced by economic indicators and central bank policies from both Australia and the United States. Today, traders are closely watching events such as the RBA Deputy Governor Andrew Hauser’s fireside chat and the IMF meeting discussing global economic issues, which may provide insights into future monetary policies. Hauser’s comments could signal potential shifts in interest rate expectations, which would be bullish for the AUD if his tone is hawkish. Meanwhile, the USD is under focus due to speeches from key Federal Reserve officials, whose statements could hint at future rate hikes, adding volatility to the AUD USD pair. The mixed economic outlook globally, coupled with these significant events, suggests that AUD/USD chart may experience heightened market movements, depending on the stance and guidance provided by these economic authorities.
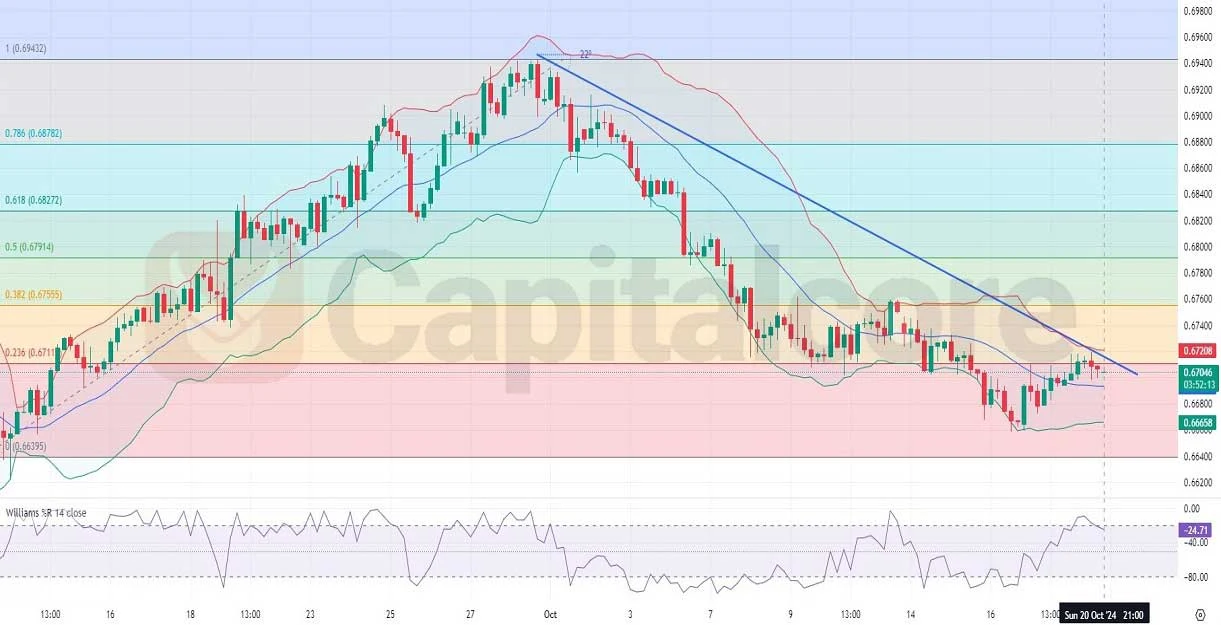
Chart Notes:
• Chart time-zone is UTC (+03:00)
• Candles’ time-frame is 4h.
In the AUD/USD H4 chart, the Aussie pair has been in a bearish trend, as indicated by the downward trajectory shown by the Fibonacci retracement levels. After touching a low near the 0.66395 level, the AUDUSD price has rebounded, moving from the lower Bollinger Band towards the upper band, suggesting a potential trend reversal. The recent price action shows that out of the last ten candles, seven have been bullish, while the last candle remains green, indicating a continuation of the upward movement. However, the two preceding candles were bearish, showing some resistance around the 0.67208 level, aligning with the Fibonacci 23.6% level. The Williams %R indicator currently reads -24.71, which is near the overbought territory, hinting at potential short-term selling pressure if the price struggles to break above the immediate resistance. For a sustained bullish move, the price needs to breach the downtrend line and the 0.67555 (Fibonacci 38.2%) level. Otherwise, a failure to do so may result in the price consolidating or retesting lower levels.
DISCLAIMER: Please note that the above analysis is not an investment suggestion by “Capitalcore LLC”. This post has been published only for educational purposes.