- October 24, 2024
- Posted By: james w
- Category: Market News
Forex Trading Strategy for EURUSD H4 Chart
The EUR/USD forex pair, often referred to as the “Fiber,” is a major currency pair in the forex market, representing the exchange rate between the Euro and the US Dollar. Today, all eyes are on the upcoming Flash PMI reports for both the manufacturing and services sectors from the Eurozone and the US. A reading above 50 indicates expansion and is positive for the respective currency. If the Eurozone’s PMI surpasses forecasts, it could offer support for the euro; however, any contraction or weaker-than-expected figures might push the EURUSD price lower. Additionally, the upcoming IMF and BRICS meetings, as well as the Federal Reserve Bank of Cleveland’s statements, could introduce volatility. Market participants are likely to monitor these closely, as their outcomes may influence both EUR and USD price action.

Chart Notes:
• Chart time-zone is UTC (+03:00)
• Candles’ time-frame is 4h.
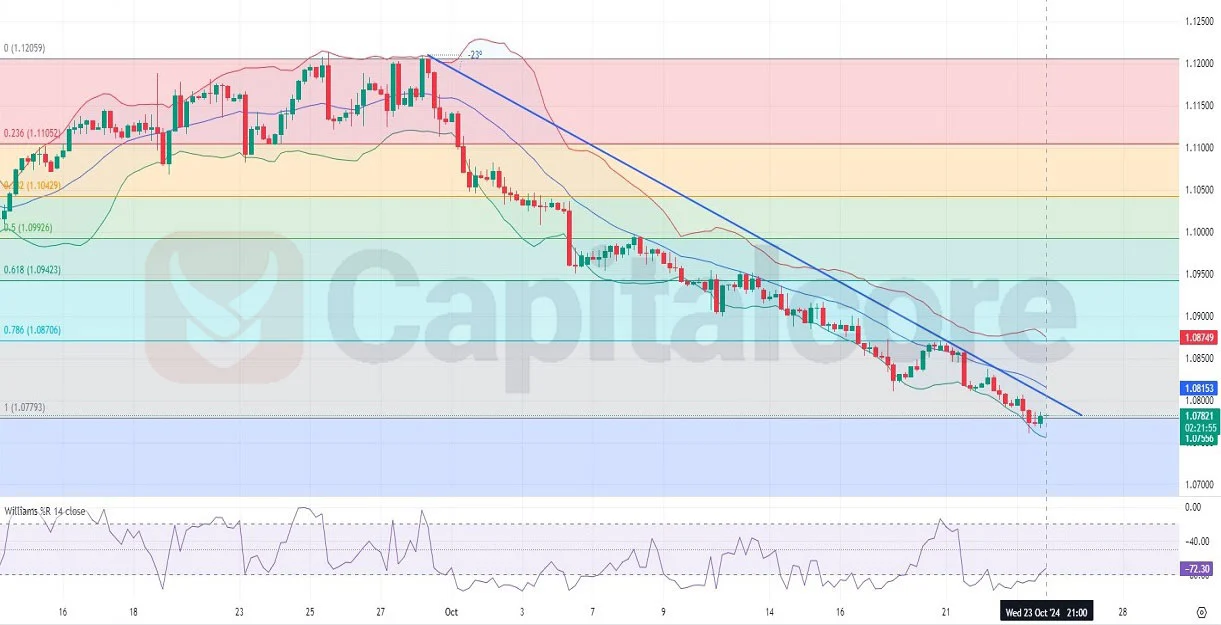
The EUR/USD H4 chart displays a bearish trend, with the price moving consistently within the lower half of the Bollinger Bands, frequently touching the lower band, indicating sustained selling pressure. Over the past ten candles, three have shown bullish movement, with the last two being positive. However, the price remains at the 1 Fibonacci retracement level, oscillating between the 1 and 0.786 levels, suggesting a struggle to break out of the downward trend. The Williams %R indicator currently hovers in the oversold region, reflecting a bearish momentum that aligns with the overall trend. The next significant support level lies near the 0.786 Fibonacci level. A break below this could lead to further declines, while a break above the descending trend line may signal a reversal.
DISCLAIMER: Please note that the above analysis is not an investment suggestion by “Capitalcore LLC”. This post has been published only for educational purposes.