- November 18, 2024
- Posted By: james w
- Category: Market News
NZDUSD Fibonacci Levels Show Potential Rebound
The NZD/USD currency pair, commonly referred to as the “Kiwi,” represents the exchange rate between the New Zealand Dollar (NZD) and the United States Dollar (USD) and is influenced by economic indicators, monetary policies, and global trade dynamics, making it a popular choice for forex traders. Today, fundamental factors could drive significant price movements, with Federal Reserve Bank of Chicago President Austan Goolsbee’s remarks potentially signaling future monetary policy; hawkish tones may strengthen the USD, while dovish comments could weaken it. Additionally, the National Association of Home Builders (NAHB) Housing Market Index will provide insights into the US housing market outlook, impacting USD sentiment. On the NZD side, BusinessNZ’s Performance of Services Index will offer clues about service-sector expansion, and the release of Producer Price Index (PPI) data could indicate inflationary pressures in New Zealand. The G20 meeting also presents a global macroeconomic backdrop that may influence the Kiwi through risk sentiment shifts.

Chart Notes:
• Chart time-zone is UTC (+02:00)
• Candles’ time-frame is 4h.
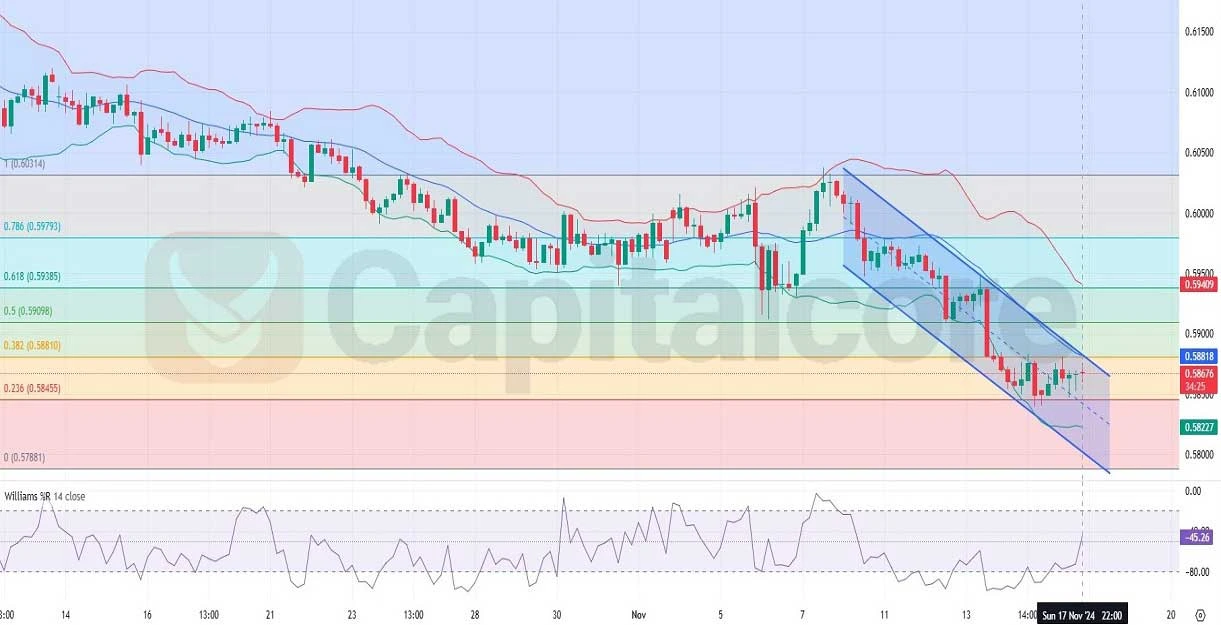
Analyzing the H4 chart for NZD USD, the pair remains in a bearish trend within a descending channel, with candlesticks primarily moving in the lower half of the Bollinger Bands and frequently touching the lower band, confirming sustained downward pressure. Despite this, there is evidence of a short-term recovery as candles attempt to push from the lower band toward the middle band, a key resistance zone. The Fibonacci retracement levels indicate the price has bounced from the 0.236 level and is currently approaching the 0.382 level (around 0.58810), suggesting some consolidation or a potential minor correction within the broader downtrend. The Williams %R indicator, hovering near oversold levels, points to the possibility of a brief pullback, but bearish momentum remains intact unless the pair breaks above the middle Bollinger Band and sustains above the 0.382 Fibonacci level.
•DISCLAIMER: Please note that the above analysis is not an investment suggestion by “Capitalcore LLC”. This post has been published only for educational purposes.