- December 2, 2024
- Posted By: james w
- Category: Market News
How US and Australian Data Affect AUDUSD Price Action
The AUDUSD, often referred to as the “Aussie,” is a widely traded currency pair representing the Australian Dollar against the US Dollar. The pair is heavily influenced by global commodity prices, especially metals and energy, as Australia is a major exporter. Today’s market focus revolves around key US and Australian data, including the Purchasing Managers’ Index (PMI) from the US and the Melbourne Institute Consumer Price Index (CPI) for Australia. The USD is expected to react strongly to PMI figures, which provide insights into manufacturing activity, while Australia’s CPI will give clues about inflation trends.
Fundamentally, the AUDUSD may experience heightened volatility due to diverging macroeconomic indicators. Positive PMI data from the US could strengthen the USD, signaling expansion in the manufacturing sector and boosting expectations for a resilient economy. Conversely, Australia’s CPI data will likely influence the AUD if it signals higher-than-expected inflation, which could prompt hawkish sentiments from the Reserve Bank of Australia (RBA). Traders should also monitor commodity prices and construction activity reports, which significantly impact the Aussie’s movement.

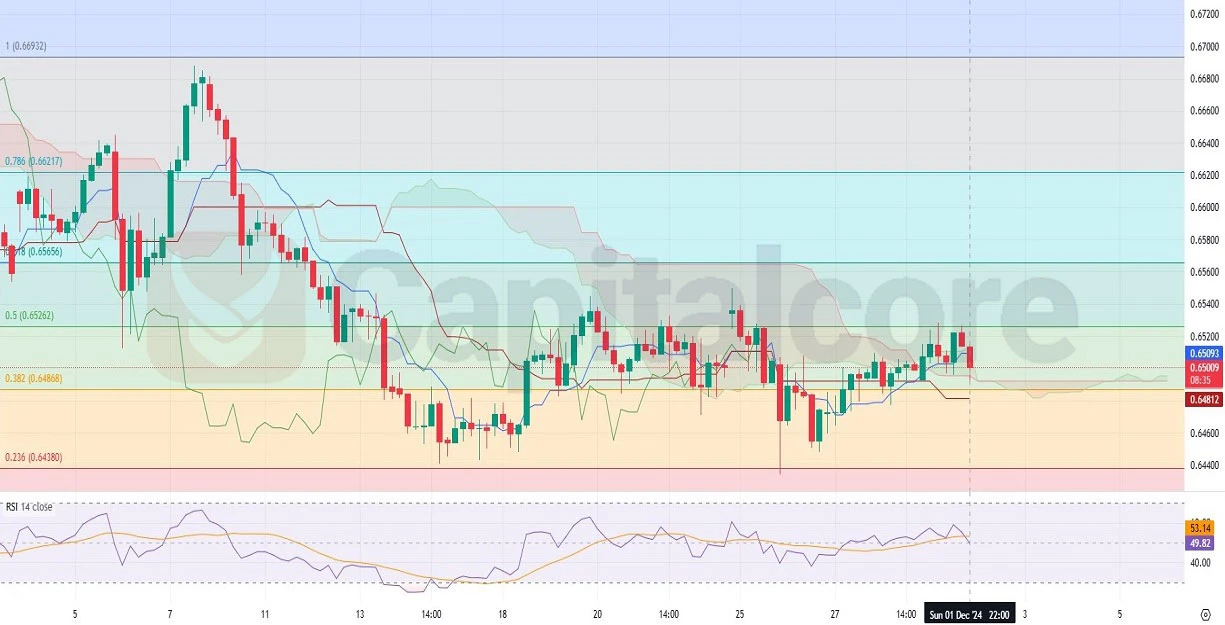
Chart Notes:
• Chart time-zone is UTC (+02:00)
• Candles’ time-frame is 4h.
On the H4 chart, AUDUSD appears to be in a mild bullish trend, although recent bearish candles indicate some downside pressure. The price is currently interacting with the Ichimoku cloud, suggesting a potential reversal zone or consolidation phase. Notably, the price is oscillating between the 0.382 and 0.5 Fibonacci retracement levels, highlighting key support and resistance areas at approximately 0.6480 and 0.6525, respectively. The last two candles are bearish, which may signal a short-term pullback. The RSI is hovering near 50, indicating a neutral momentum, with no strong overbought or oversold conditions.
If the price breaks above the Ichimoku cloud and the 0.5 Fibonacci level, it could continue its bullish trajectory toward the 0.786 Fibonacci level around 0.6620. However, if the bearish momentum persists, a drop below the 0.382 level could open the door for further declines toward the 0.236 Fibonacci level around 0.6430.
• DISCLAIMER: Please note that the above analysis is not an investment suggestion by “Capitalcore LLC”. This post has been published only for educational purposes.