- December 12, 2024
- Posted By: james w
- Category: Market News
Downside Risks and Potential Recovery in AUDUSD
The AUD/USD currency pair, often called the “Aussie,” is a major Forex instrument that reflects the economic health of both Australia and the United States. With Australian Employment Change and Unemployment Rate data due for release, traders will closely watch these key labor-market indicators to gauge the pace of Australia’s economic recovery, while upcoming US releases, including Core PPI, PPI, and Unemployment Claims, will offer insight into inflationary pressures and employment trends in the US. Overall, these fundamental factors could drive significant price action in the AUD USD daily chart, as investors anticipate shifts in monetary policy and risk sentiment.

Chart Notes:
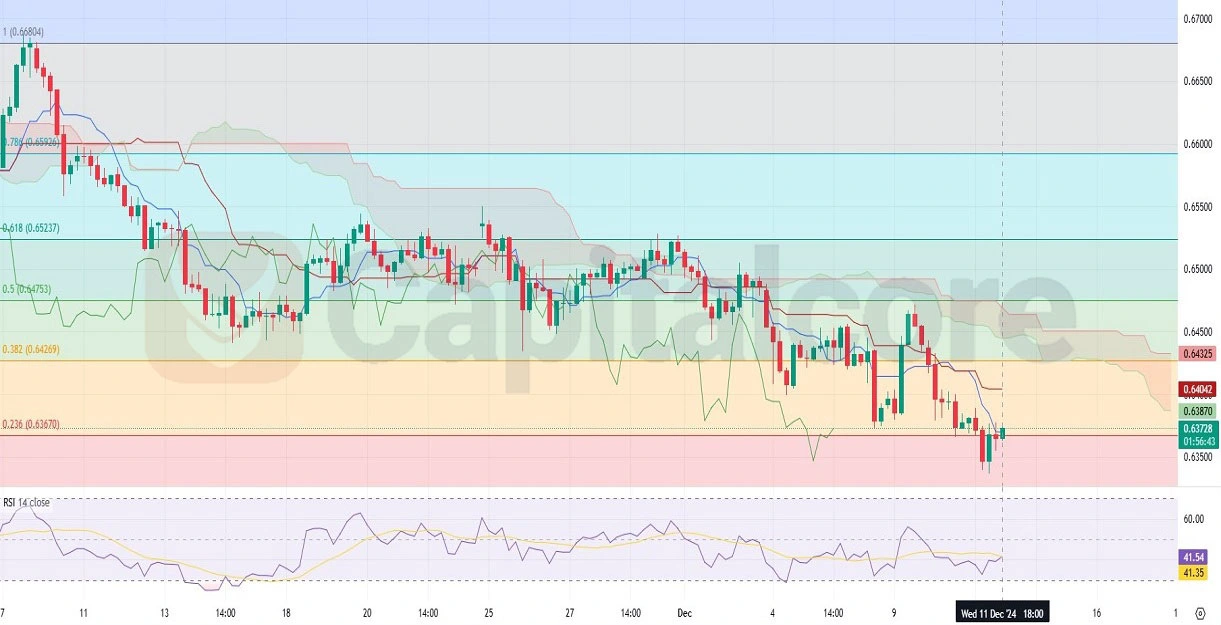
• Chart time-zone is UTC (+02:00)
• Candles’ time-frame is 4h.
On the AUDUSD H4 chart, the price is in a bearish trend with bearish candles moving below the Ichimoku cloud, hovering around the 0.236 Fibonacci retracement level which can work as the first support level, while the RSI is trending lower, suggesting potential oversold conditions that may limit immediate downside. The AUD-USD daily chart technical and fundamental analysis indicates that if the pair breaks below this key support, it could open the door to further declines, but any signs of improving economic data or easing US inflation could offer buying opportunities and spark a reversal in the price action.
• DISCLAIMER: Please note that the above analysis is not an investment suggestion by “Capitalcore LLC”. This post has been published only for educational purposes.