USD/JPY Broke below the trend line
The price line on USD/JPY started an ascending trend on August 2nd, 2022; within which, this pair was able to gain about 11.46% value until 22nd of September 2022, when the price line had the final ascending wave and then broke below the trend line of the ascending wave.
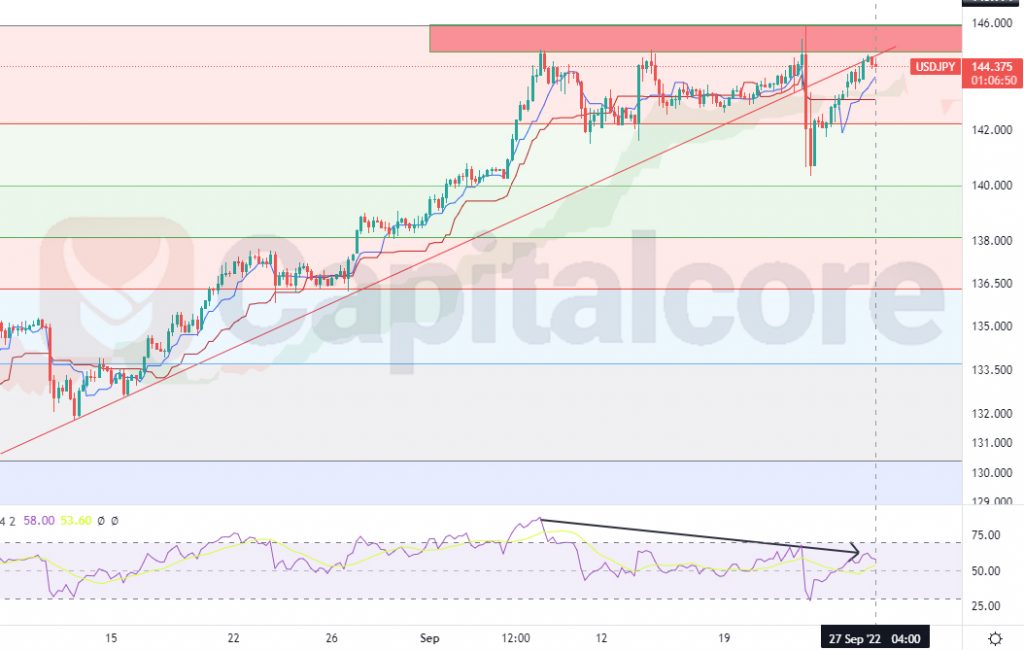
Chart Notes:
• Chart time-zone is UTC (+03:00)
• Candles’ time-frame is 4h.
The price line on USD/JPY is now about to complete a retest of the broken ascending wave. The price on this pair is now on 144.375, which is located just below a strong resistance level, represented as a red zone above the price line. This area is considered an important resistance level. as it has already been able to dump the price line. RSI is showing negative divergence comparing to the price line. The light colorful levels are the Fibonacci retracement levels on the previous ascending wave. Sellers can be expecting a descending leg to come shortly. The target for the bearish wave could be considered on 142.302 and 140.256. Also consider that the validity of this analysis would reduce significantly , if the price line breaks above the red trend line, or above 146 once more.
• DISCLAIMER: Please note that the above analysis is not an investment suggestion by “Capitalcore Ltd”. This post has been published only for educational purposes.