A retest of the broken ascending trendline or another free fall?
Gold has been under pressure since its last decline and the US is getting empowered as well. so the next move of Go0ld price will be bearish as CapitalCore Ltd predicts; how ever there are many other possibilities too. in the following we have prepared for you Gold price chart analysis. you can use the given information to complete your trading strategies.
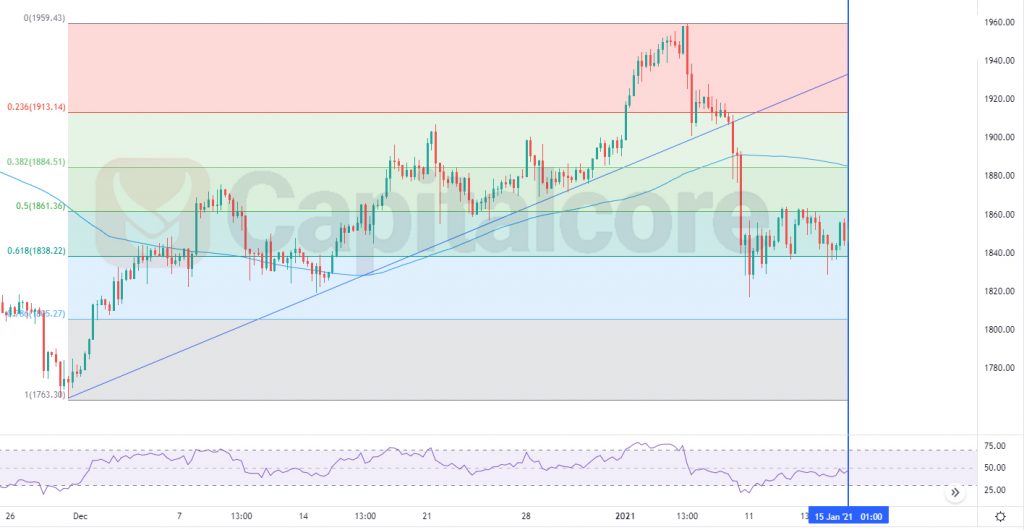
Chart Notes:
• Chart time-zone is UTC (+03:00)
• Candles’ time-frame is 4h.
The support rests at 1838.10 with resistance at 1856.70 which the weekly pivot point at 1875.23 is located above the lines. The EMA of 10 is moving horizontally in the descendant channel and it is below EMA of 100 and 200. The Stochastic is moving in middle ranges, the RSI is rising towards level 50 and the MACD indicator is in positive territory. The ADX is not showing any clear signals. The price is in the Ichimoku Cloud and above the Chinkou Span. The Tenkan-sen is showing a horizontal trend and the Kijun-sen is showing an upward trend.
Gold may grow towards the weekly pivot point but it is not going to grow further.
• DISCLAIMER: Please note that the above analysis is not an investment suggestion by “Capitalcore Ltd”. This post has been published only for educational purposes.