A smooth ascending wave is expected
USD/CAD started a sideway market at the beginning of July 2021, the price line started bouncing between a support and a resistance zone since then and has not been able to break out of that range. Currently the price line is getting close to a support level and a smooth bullish phase seems close to take place.
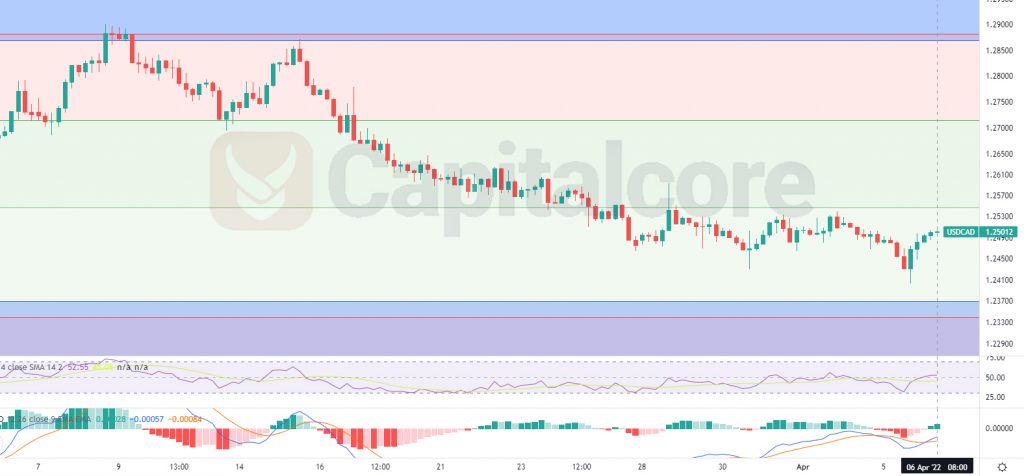
Chart Notes:
• Chart time-zone is UTC (+03:00)
• Candles’ time-frame is 4h.
On USD/CAD price chart, the price line is on 1.25012 at the moment which would be, between level 0.236 and 0.382 of the Fibonacci retracement on the previous strong descending wave. RSI is almost on 53 and is indicating a very smooth descending wave to take place shortly. MACD is showing an ascending wave on going. The blue zone below the price line indicates the support level which has been able to pump the price line several times previously. Traders can be waiting for the price line to touch the support zone, then they can enter long positions heading to 1.288. For a safer trade, traders can have a retail stop at different Fibonacci levels.
Please note that this theory is valid as long as the price line has not exited the trading range between two blue zones on the chart
• DISCLAIMER: Please note that the above analysis is not an investment suggestion by “Capitalcore Ltd”. This post has been published only for educational purposes.