GBPUSD Trading Strategies Based on Recent Indicator Trends
The GBPUSD forex pair, commonly referred to as the “Cable,” represents the exchange rate between the British Pound (GBP) and the US Dollar (USD). It is one of the most traded currency pairs in the world, offering significant liquidity and numerous trading opportunities due to its relative volatility and market depth. The nickname “Cable” originates from the first transatlantic communication cable that connected the UK and USA, which was used to transmit currency prices between the two economies. Today’s fundamental analysis for GBPUSD is shaped by a series of high, middle, and low impact news events affecting both currencies. For the GBP, key releases include the Claimant Count Change and Average Earnings Index, which are crucial indicators of labor market health and are likely to influence the Bank of England’s monetary policy decisions. Simultaneously, the USD faces its own critical data with the Unemployment Claims and the Philly Fed Manufacturing Index, providing insights into the US economic landscape. The interplay of these reports could lead to increased volatility and trading opportunities in the GBPUSD pair, with potential strengthening in the Pound if the UK’s employment data outperforms expectations and weakening if US data suggests a robust economic outlook.
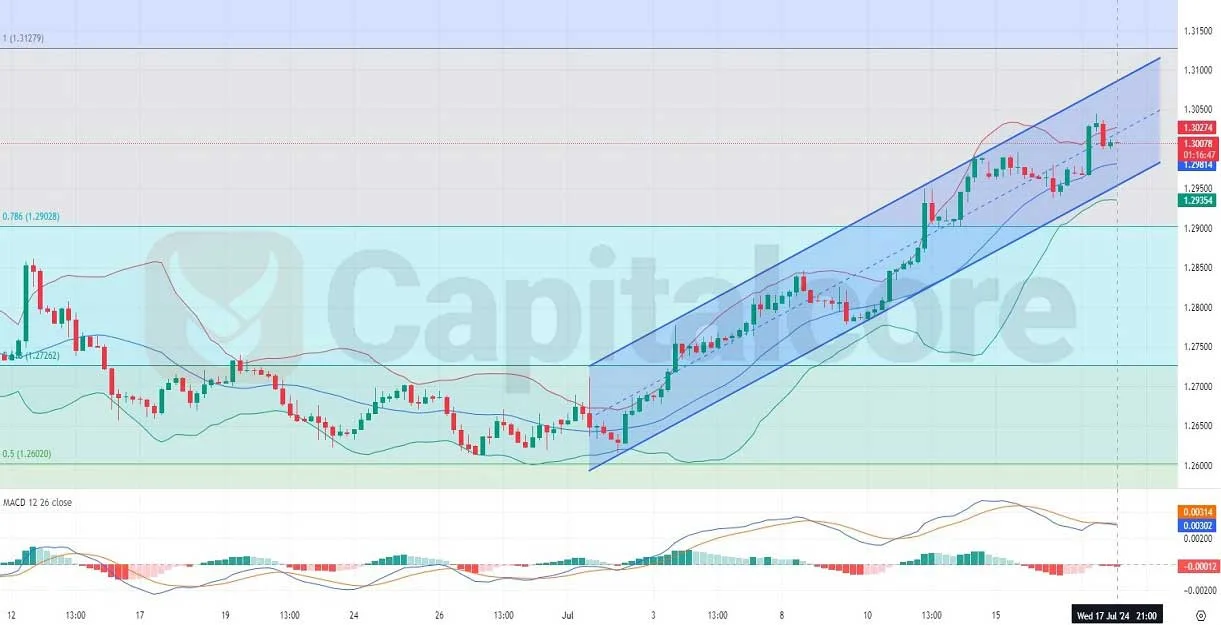
Chart Notes:
• Chart time-zone is UTC (+03:00)
• Candles’ time-frame is 4h.
Analyzing the uploaded H4 chart of the GBPUSD pair with indicators such as Bollinger Bands, MACD, and Fibonacci levels, we observe a bullish trend. The candles have predominantly been in the upper half of the Bollinger Bands, oscillating between the middle and upper bands, indicating a sustained uptrend. The MACD shows a bullish momentum as it remains above the signal line. Additionally, the recent price action respecting the Fibonacci retracement levels suggests strong support and resistance zones, aiding traders in identifying potential entry and exit points.
• DISCLAIMER: Please note that the above analysis is not an investment suggestion by “Capitalcore LLC”. This post has been published only for educational purposes.