- June 3, 2024
- Posted By: Paris Blanc
- Category: Market News
Bullish Signals Dominate USD/JPY Chart Analysis
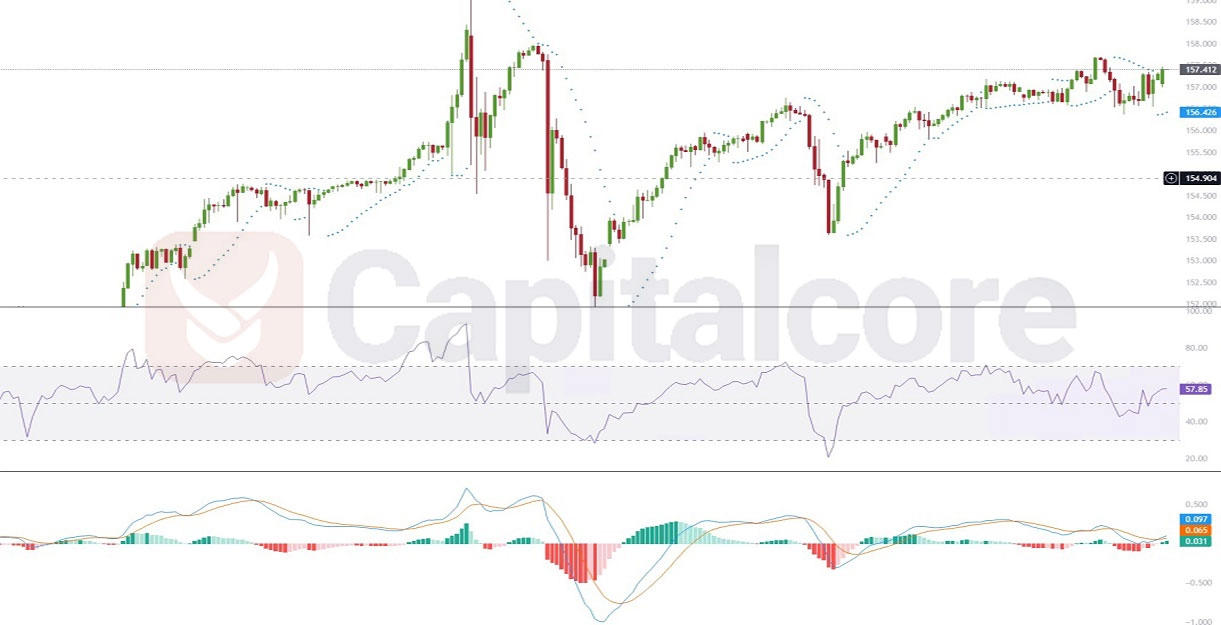
The Parabolic SAR dots positioned below the candles indicate a buy signal, supporting the overall bullish trend observed in the USD/JPY pair. This aligns with other technical indicators that also point towards a continued upward trajectory. Investors should monitor these indicators closely as they provide a strong indication of bullish momentum. The current technical setup suggests that traders can expect the USD/JPY pair to maintain its upward trend, making it a favorable opportunity for bullish positions in the short to medium term.

Chart Notes:
• Chart time-zone is UTC (+03:00)
• Candles’ time-frame is 4h.
In summary, the USD/JPY technical analysis today highlights a strong bullish trend supported by key indicators such as the MACD, RSI, and Parabolic SAR. Traders and investors following the usd/jpy forecast should consider these signals when making their investment decisions. In summary, the USD/JPY technical analysis today highlights a strong bullish trend supported by key indicators such as the MACD, RSI, and Parabolic SAR. Traders and investors following the USD/JPY forecast should consider these signals when making their investment decisions. The alignment of multiple bullish indicators provides a robust basis for anticipating continued upward momentum in the USD/JPY pair. However, it is essential to stay vigilant and keep an eye on live market analysis, as market conditions can change rapidly. Adjusting strategies in response to new data and market movements can help maximize potential gains and mitigate risks. By staying informed and responsive, traders can better navigate the dynamic forex market.As always, it’s crucial to stay updated with live market analysis and adjust strategies accordingly to maximize potential gains.
https://capitalcore.com/wp-content/uploads/2024/05/H4-Chart-technical-Analysis-for-GBPUSD-on-31-05-2024.webp