- October 25, 2024
- Posted By: james w
- Category: Market News
Forecasting USD/CAD H4 Movement with Economic Indicators
The USD/CAD currency pair, often called the “Loonie,” is one of the major forex pairs traded globally, representing the value of the US dollar against the Canadian dollar. The USD/CAD fundamental analysis today is influenced by economic data from both countries, such as U.S. durable goods orders and Canadian retail sales figures, which are critical indicators of economic performance and consumer activity. Today’s Loonie news analysis has its focus on the U.S. durable goods data and the University of Michigan Consumer Sentiment, which may signal shifts in economic confidence and manufacturing trends. Strong U.S. data could boost the USD, pushing the pair higher, while disappointing figures may weaken the dollar, potentially leading to a decline in the USD/CAD exchange rate. On the Canadian side, traders will also monitor upcoming retail sales data and housing price indices. Strong retail sales figures could strengthen the CAD, as it would suggest robust consumer spending, the backbone of the Canadian economy. Conversely, if the data underperforms, it may weigh on the CAD, allowing USDCAD’s bullish trend to continue.

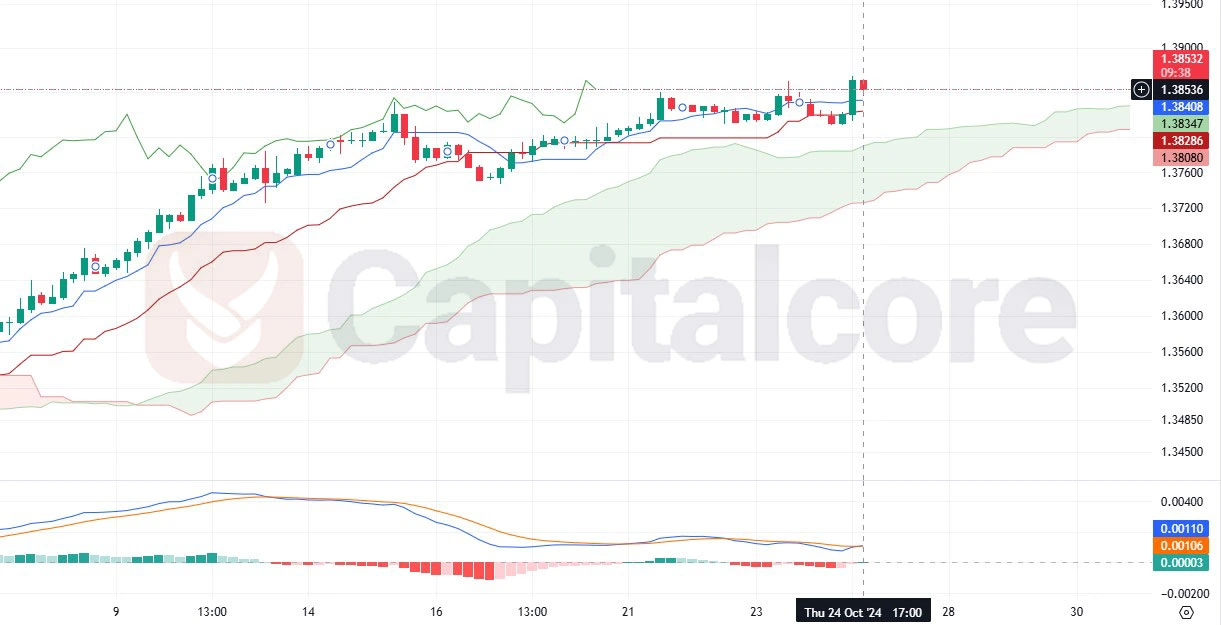
Chart Notes:
• Chart time-zone is UTC (+03:00)
• Candles’ time-frame is 4h.
On the USD/CAD H4 chart, the pair’s technical forecast today with confirmation from the Ichimoku Cloud and MACD indicators, reveals a nuanced picture. The Ichimoku Cloud shows that the price is currently above the cloud, indicating a bullish trend, but with recent candles hovering close to the cloud’s upper boundary, suggesting a potential test of this support level. If the pair’s price keeps trading above the cloud, it could signify continued bullish momentum, while a break below might signal a bearish shift. The MACD indicator shows the histogram hovering near the zero line, with the MACD line and the signal line close to each other, indicating a lack of strong momentum and possible consolidation. If the MACD line crosses above the signal line and gains upward momentum, it could confirm a bullish continuation; otherwise, a downward cross may suggest increasing bearish pressure ahead.
• DISCLAIMER: Please note that the above analysis is not an investment suggestion by “Capitalcore LLC”. This post has been published only for educational purposes.