- June 17, 2024
- Posted By: james w
- Category: Market News
Gopher’s Trends and Economic Indicators in Forex Market Insight
The USDJPY forex pair, often referred to by its nickname “Gopher,” represents the exchange rate between the US dollar and the Japanese yen. As one of the most traded currency pairs in the forex market, it is influenced by the economic activities of the United States and Japan. Traders closely monitor this pair for its high liquidity and the impact of economic indicators from both countries. Fundamental analysis for today suggests that the USDJPY might experience some volatility due to key economic data releases. From Japan, the Core Machinery Orders m/m report is expected, with a forecast of -2.9%. This low-impact indicator reflects changes in the total value of new private-sector purchase orders placed with manufacturers for machines, excluding ships and utilities. A higher-than-expected value would be positive for the JPY. Meanwhile, the US will release the Empire State Manufacturing Index, with a forecast of -12.5, indicating worsening conditions if the actual figure is below 0.0. Given its high impact, a better-than-expected result could boost the USD, as it is a leading indicator of economic health based on surveyed manufacturers in New York state. These contrasting data releases could create a dynamic trading environment for USDJPY forex pair today.

Chart Notes:
• Chart time-zone is UTC (+03:00)
• Candles’ time-frame is 4h.
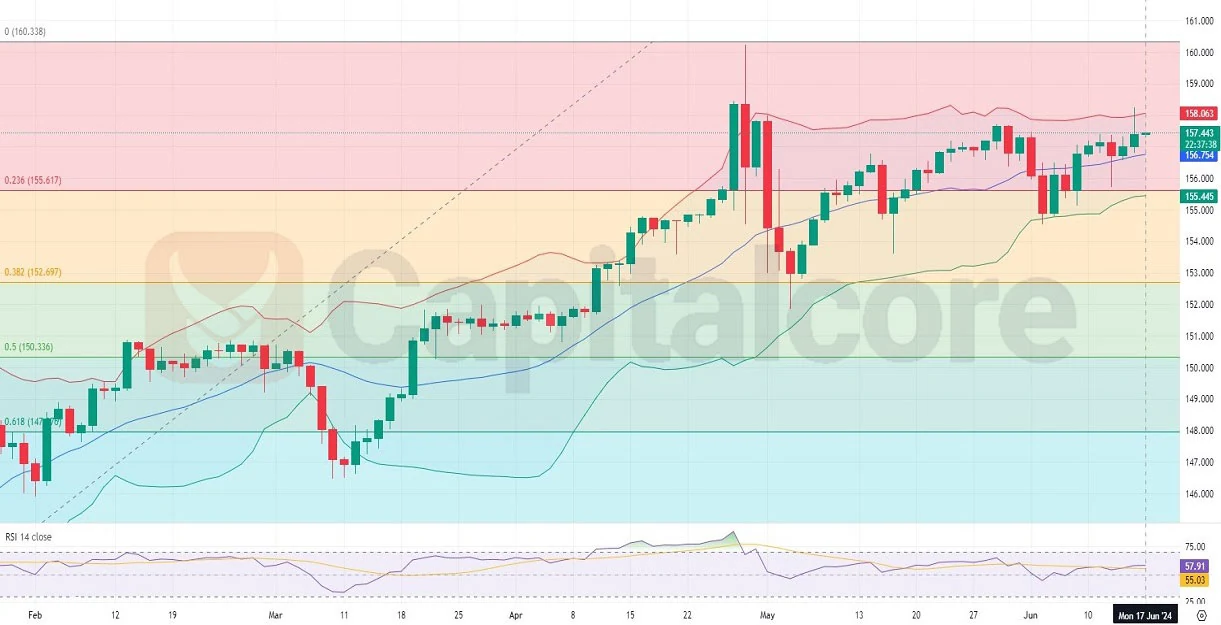
Analyzing the H4 chart of USDJPY, we observe several technical indicators. The recent price action shows the last ten candles moving from the lower Bollinger Band toward the upper band, crossing the middle band. The last six candles have remained in the upper half of the Bollinger Bands, with the most recent three candles being green and one bearish. The current candle is bullish so far. Bollinger Bands have tightened slightly, indicating reduced volatility, but are not tight enough to signal an imminent breakout. The RSI is positioned above the 50 level, suggesting a bullish momentum of USDJPY. The visible Fibonacci levels indicate key support and resistance zones that traders should watch. Overall, the chart signals a cautiously bullish sentiment, with potential resistance around the 158.063 level and support near 155.617.