The descending wave looks to be ending
The price line on AUD/CAD has been descending since 23rd of February 2021. Recently the descending slope on the chart has been reducing and at the moment and the price line has reached a strong support zone. The next few candles on the chart would be of high importance to analyze and predict the next move of the price chart.
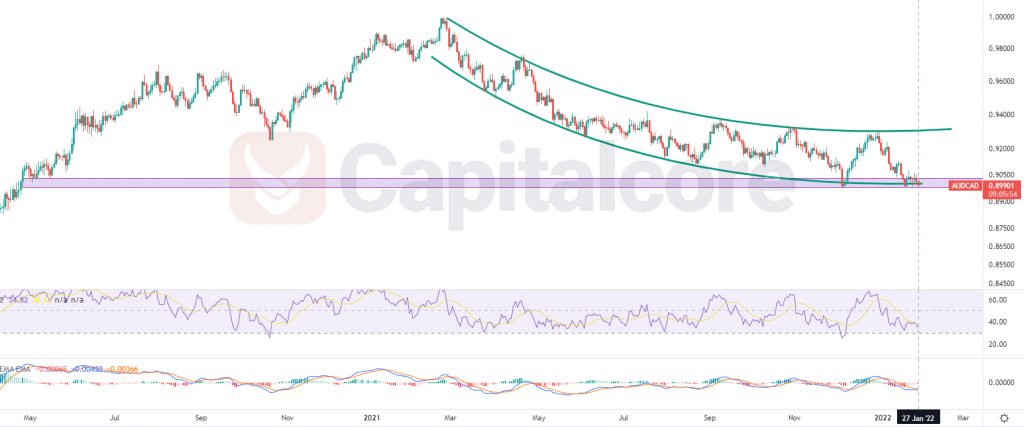
Chart Notes:
• Chart time-zone is UTC (+03:00)
• Candles’ time-frame is daily.
The price at the moment is on 0.899 . There is a strong support zone below the price line on 0.896 – 0.9 . The price line is currently touching the support zone. RSI is almost on 34.5 and is showing positive divergence. The green channel on the chart indicates the price behavior during the descending wave. As you can see on the chart, The descending slope is reducing and currently the slope is trending to zero. In case the purple zone can pump the price up once more, buyers can enter the market and target 0.9267 and 0.959. Please consider that in case the price line breaks below the purple zone, the price can fall to 0.8815.
• DISCLAIMER: Please note that the above analysis is not an investment suggestion by “Capitalcore Ltd”. This post has been published only for educational purposes.