The price line broke above the bearish channel
After a long journey within a bearish channel the price line on AUD/CAD could finally break above the this channel and is now having a retest of the top line of that. Different indicators are showing bullish potential on this pair and the overall look of the chart is bullish.
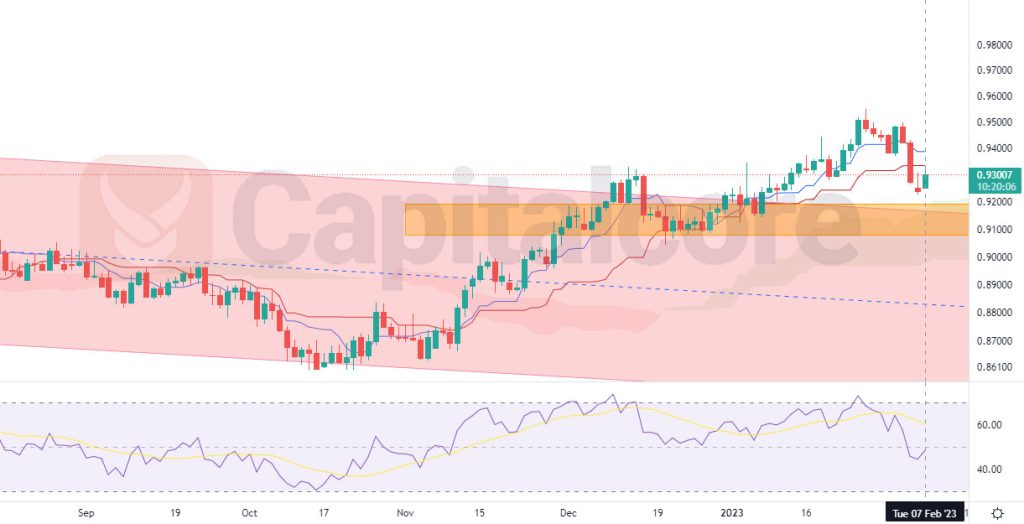
Chart Notes:
• Chart time-zone is UTC (+03:00)
• Candles’ time-frame is daily.
The price line is currently at about 0.93000, just above the channel and candle steak pattern is also showing possible trend reversal. The green zone on the chart reflects the support zone, which could be considered as the target for the bearish leg. RSI is below 50 and is tending to move upwards. The red descending zone, indicates the bearish channel, within which the price line had been moving for a long while. Ichimocu cloud is placed below the price line and seems to be backing it up. Traders could expect a bullish wave heading to the resistance levels at 0.96000 and 0.97600 after that.
• DISCLAIMER: Please note that the above analysis is not an investment suggestion by “Capitalcore Ltd”. This post has been published only for educational purposes.