- December 17, 2021
- Category: Market News
The support level looks too fragile to hold the price
AUD/CAD has been moving within a descending channel since the beginning of 2021. The price line has reacted several times to the top, mid and base line of the channel. At the moment the price is once more on the top line of the channel. The overall look of the chart is bearish.
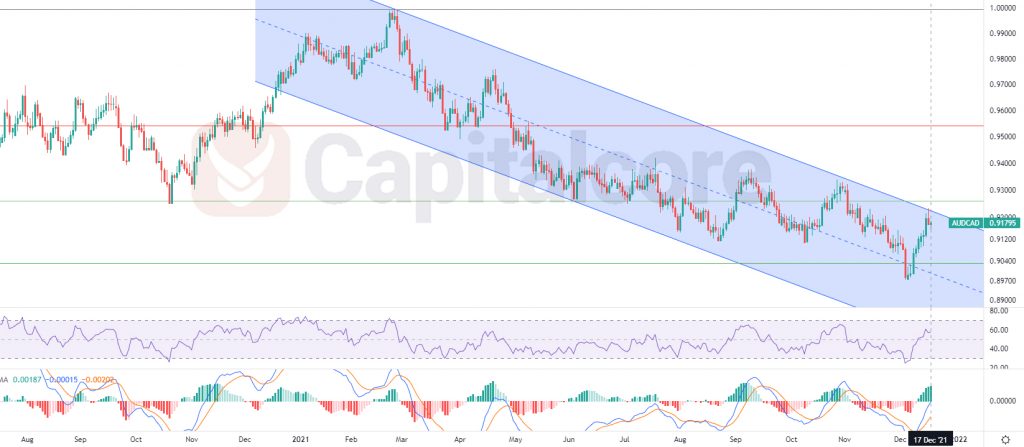
Chart Notes:
• Chart time-zone is UTC (+03:00)
• Candles’ time-frame is 4h.
the price is on 0.91795 at the moment. The resistance levels above the price line are the dynamic resistance, on top of the channel, and level 0.382 of the previous ascending wave, around 0.926. RSI indicator is above the mid line, on about 60. The RSI are not showing weakening of the ascending wave yet. The previous daily candle is a bearish pinbar and shows the possibility of a trend reversal. Sellers can enter the market in case the price line retests the top line once more. the possible target for the descending wave could be 0.9035 and 0.8859. Please note that breaking above 0.906 will highly reduce the chance of the trend reversal.
• DISCLAIMER: Please note that the above analysis is not an investment suggestion by “Capitalcore Ltd”. This post has been published only for educational purposes.