The price line is on a strong resistance
AUD/CHF started a bearish trend on 2nd of April 2021 and descended more than 11% until 3rd of December 2021; the price line then started a bullish trend and could break above the descending trend line on 9th of March 2022. The price line at the moment is approaching to level 0.382 of the Fibonacci retracement and some negative signals have been issued.
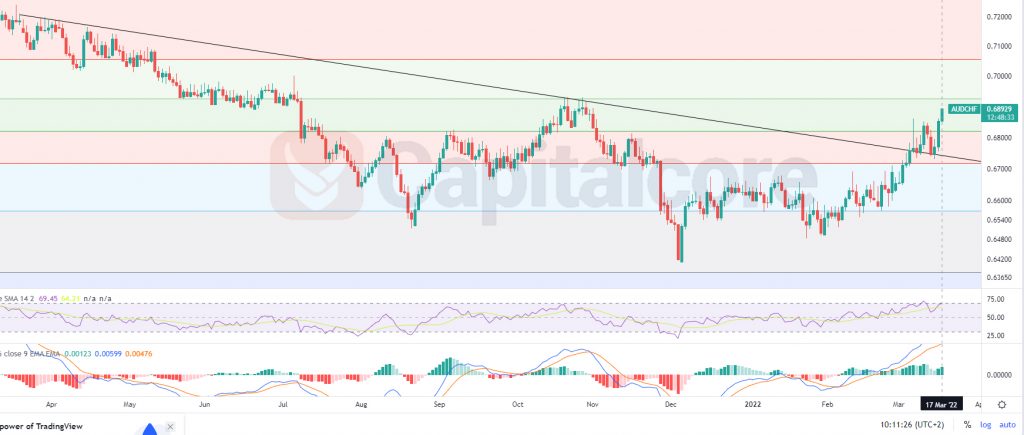
Chart Notes:
• Chart time-zone is UTC (+03:00)
• Candles’ time-frame is daily.
The price line at the moment is on 0.68929 which would be just below level 0.382 of the Fibonacci retracement. The black line on the chart indicates the trend line within which the descending phase took place. The green thin line above the price line indicates level 0.382 of the Fibonacci retracement; this level is of importance as the previous ascending wave could not break above this area despite the struggle. RSI is almost on 70 and it has already issued negative divergence signals. MACD is still showing bullish trend on going. Traders can be waiting for the price line to reach out to the Fibonacci level and after any descending trigger and then they can enter short positions; the target for the descending wave could be considered on 0.6733 and 0.66. This theory is considered valid as long as the price line has not broken above the Fibonacci level.
• DISCLAIMER: Please note that the above analysis is not an investment suggestion by “Capitalcore Ltd”. This post has been published only for educational purposes.