Technical Analysis: AUD/CHF Bearish Wave and Correction
The AUD/CHF currency pair, often referred to by traders as the “Aussie-Swiss,” is currently experiencing a significant bearish trend. This downtrend is evident from the recent price movements shown in the chart, where the pair has been on a consistent decline, breaching several support levels. The price line has recently started a correction phase but remains below the 50-period moving average (MA), indicating that the overall bearish sentiment is still dominant. The pair’s inability to cross above this MA suggests that the bearish pressure is likely to persist.
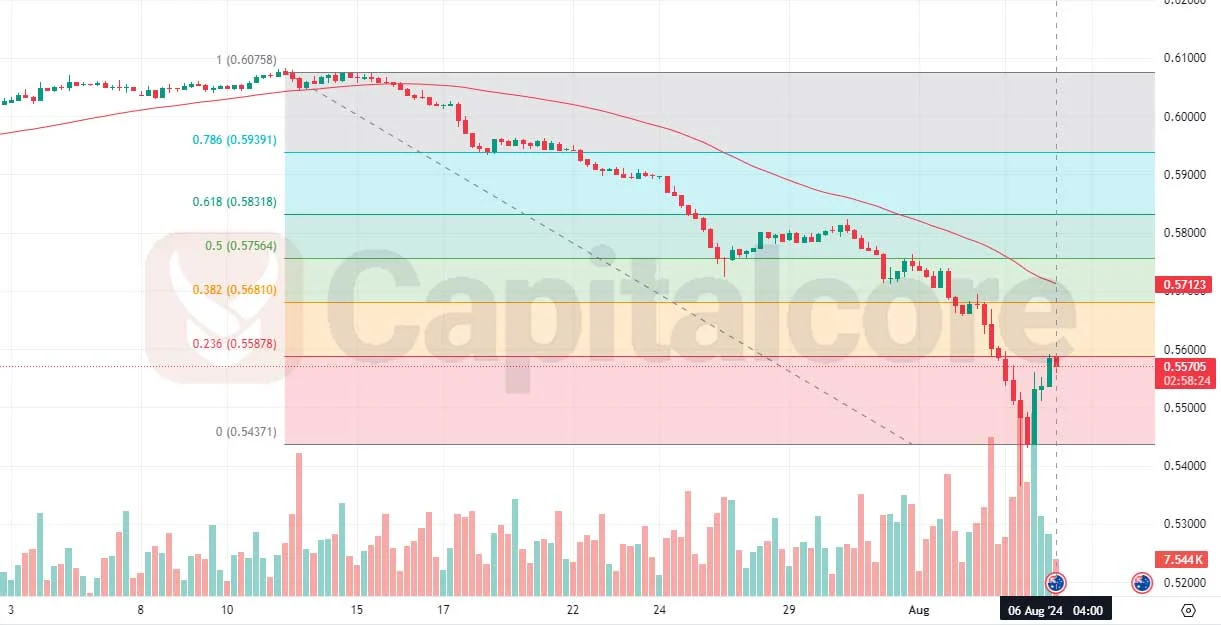
Chart Notes:
• Chart time-zone is UTC (+03:00)
• Candles’ time-frame is 4h.
At present, the bullish correction has reached the 0.236 level of the Fibonacci retracement drawn from the recent high of 0.60758 to the low of 0.54371. This retracement level is crucial as it often acts as a resistance in a strong downtrend. Given the current market conditions and the lack of significant bullish momentum, it is expected that the AUD/CHF pair will resume its bearish trajectory. The bears appear to be maintaining control, and unless the price breaks above the 0.236 level with substantial volume, the downtrend is likely to continue. Traders should watch for any signs of a further decline, especially if the price fails to sustain above this retracement level.
• DISCLAIMER: Please note that the above analysis is not an investment suggestion by “Capitalcore LLC”. This post has been published only for educational purposes.