Trend reversal seems to be close
AUD/USD price line had been moving within a descending channel. The price reached level 0.382; then it started an up trend and was able to break above the channel. RSI indicator is showing 55. A strong ascending wave is expected in the next few days.
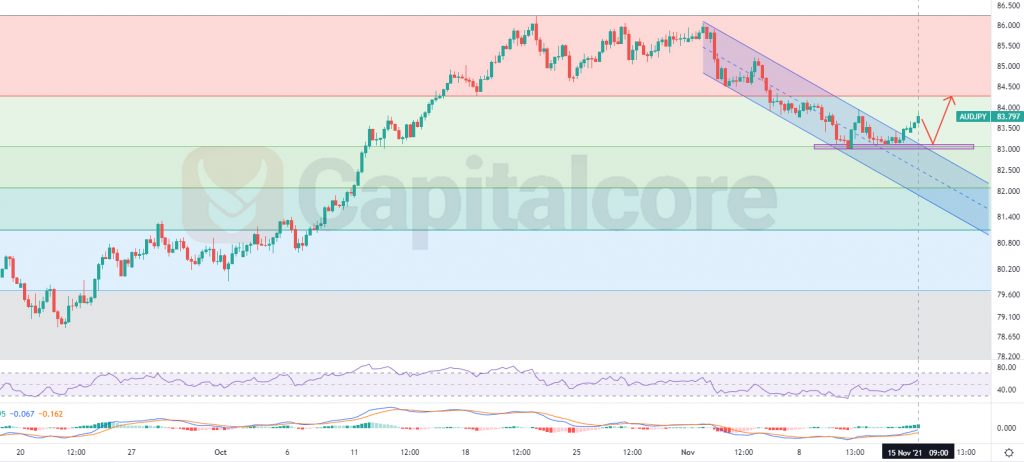
Chart Notes:
• Chart time-zone is UTC (+03:00)
• Candles’ time-frame is 4h.
The price is currently on a resistance level 83.8 – 83.95. RSI indicator is showing negative divergence and MACD is showing strong ascending wave. The price is expected to have a retest of the broken channel as well as the support level on 0.328 of the Fibonacci retracement which would be around 83 – 83.1. After the retest, buyers can enter the market and aim 84.28 as the first target of the ascending wave and 85.5 as the next one. Sellers can enter the market if the price breaks below 83 . in this case bears can aim for 82.1 and 81.1 as the second TP.
• DISCLAIMER: Please note that the above analysis is not an investment suggestion by “Capitalcore Ltd”. This post has been published only for educational purposes.