- March 18, 2022
- Category: Market News
The trend is about to be reversed
AUD/JPY started a bullish trend on 28th of January 2022 and it has been able to ascend more than 9.5% so far; At the moment the price line is reacting to a resistance level, some trend reversal signals have been issued and the next few days are probably critical for the pair.
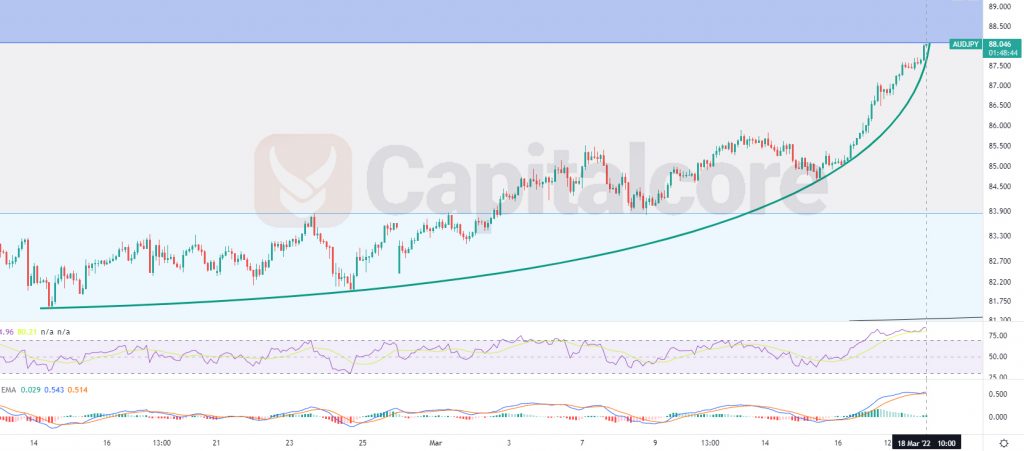
Chart Notes:
• Chart time-zone is UTC (+03:00)
• Candles’ time-frame is 2h.
The price line at the moment is showing 88.046, which would be just below the resistance zone which is shown as a blue area above the price line. The green line on the chart indicates the trend line, above which the bullish rend was formed. As it is shown on the chart, the ascending slope of the price line is increasing. The blue box above the price line is a strong resistance; this area lays just on the previous climax on weekly chart. RSI is on overbuying area, showing almost 85. MACD is showing weakness in the ascending trend. Traders can be waiting for a descending trigger, then they can enter short positions, heading to 84.3 and 83.1 . Please note that ascending above 90 would highly decrease the chance of descending phase to occur.
• DISCLAIMER: Please note that the above analysis is not an investment suggestion by “Capitalcore Ltd”. This post has been published only for educational purposes.