The next few candles are of high importance
The price line on AUD/JPY chart started an ascending wave on 3rd of December 2021 and could move above a dynamic support line. The pair ascended up to 6.85% until 5th of January 2022. Then a descending wave started and formed a dynamic resistance above the trend line.
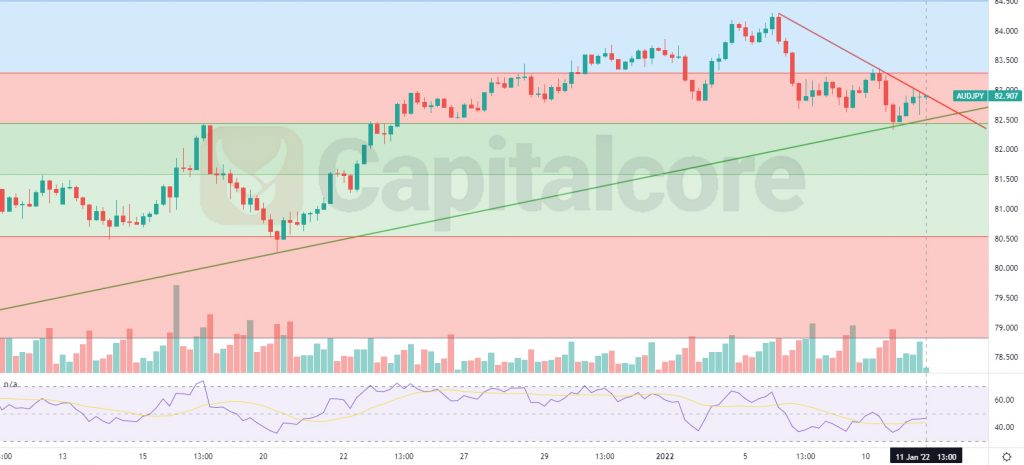
Chart Notes:
• Chart time-zone is UTC (+03:00)
• Candles’ time-frame is 4h.
The price on AUD/JPY at the moment is on 82.9 which would be just below the resistance level, shown as a red line on the chart. There is also a dynamic support below the price line which has been shown as a green line. The support line almost equals to level 0.5 of the Fibonacci retracement; on the chart it is the line between green and red area. RSI at the moment is showing almost 45 and is showing positive divergence comparing to the price line. Buyers can be waiting for the price line to break above the red line and then on the retest of this area, they can enter the market. Possible targets for the ascending wave would be 84 and 84.95.
• DISCLAIMER: Please note that the above analysis is not an investment suggestion by “Capitalcore Ltd”. This post has been published only for educational purposes.