The descent is still on going
AUD/USD started a descending rally on the first of November. The slop of each descending leg increased during the descending wave which indicates that the wave is still powerful. No indicator has issued any trend reversal signals yet and the descending wave is still on going.
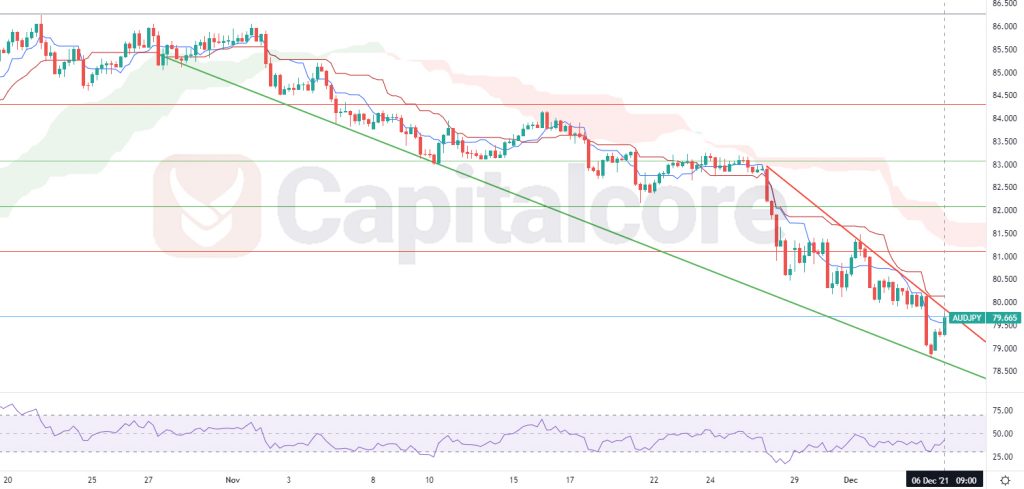
Chart Notes:
• Chart time-zone is UTC (+03:00)
• Candles’ time-frame is 4h.
In AUD/JPY price chart, the price is 79.66 at the moment, below level 0.786 of the Fibonacci retracement. There is a dynamic resistance above the price line, colored in red. the price is touching this resistance at the moment. The green line is also showing showing a dynamic support level. RSI is showing a positive divergence and ichimoku cloud is above the price line, in red. In case the price breaks above the resistance level, Buyers can target level 0.618 of the Fibonacci level on 81.1. On the other hand, sellers can target 77.9 if the price cant penetrate the resistance level.
• DISCLAIMER: Please note that the above analysis is not an investment suggestion by “Capitalcore Ltd”. This post has been published only for educational purposes.