- February 10, 2022
- Category: Market News
The price is on a strong resistance
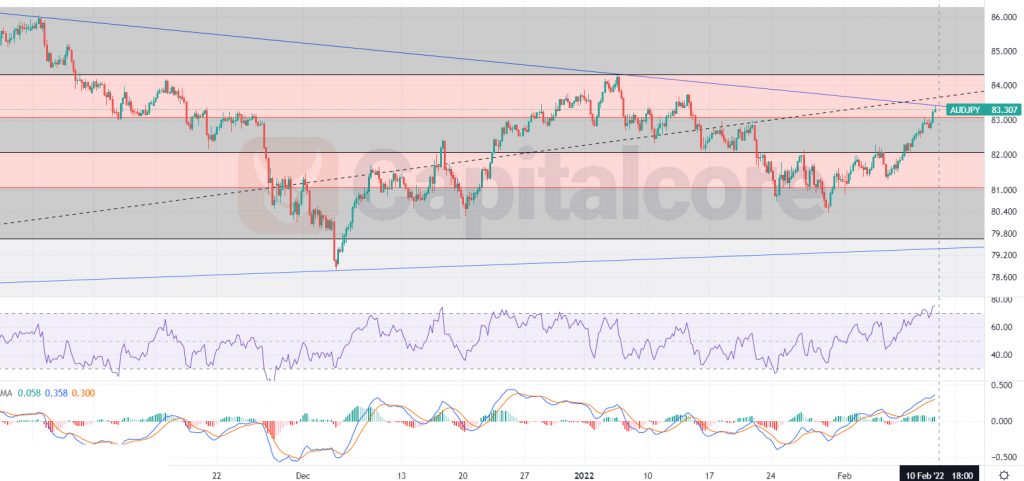
AUD/JPY, after a descending wave, entered bullish phase on 28th of January 2022 and could ascend up to 3.8% until today. The price line now is on a strong resistance and sell signals have been issue. Traders should keep an eye on this pair to find a good entrance.

Chart Notes:
• Chart time-zone is UTC (+03:00)
• Candles’ time-frame is 4h.
The price on AUD/JPY price chart is on 83.3 at the moment, which would be just above level 0.382 of the Fibonacci retracement. RSI is on 74 and is also showing negative divergence. MACD is showing a bullish wave on going; MACD line is about to cut below signal line, which would be a sell signal. The resistance above the price line looks to strong to be broken and therefore long position is not a good option. Traders can be waiting for the price line to break its short term ascending trend and then they can enter short positions; 81.3 and 80.5 can be targets for the descending wave. Please consider that in case the price line beaks above the blue line significantly, the theory would be out dated.
• DISCLAIMER: Please note that the above analysis is not an investment suggestion by “Capitalcore Ltd”. This post has been published only for educational purposes.