The bullish power seems to be weakening
The price line on AUD/NZD price chart ignited a bullish wave on December 18th, 2022. As a result of this wave the price line on this chart was pumped to a strong resistance level at around 1.10000. At this moment, different indicators are issuing bearish signals and the potential of a bearish wave seems to be close.
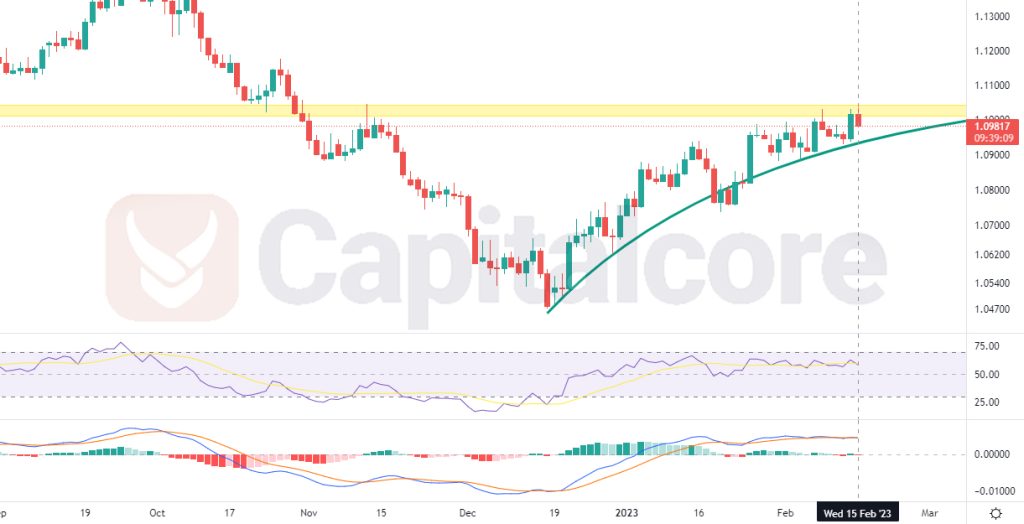
Chart Notes:
• Chart time-zone is UTC (+03:00)
• Candles’ time-frame is daily.
The green line below the price line indicates the ascending slope of the bullish wave and as it is shown on the price chart, the slope is reducing. The yellow zone, indicates the resistance level and is considered of high importance as it was already able to make several reactions to the price line. RSI is issuing negative divergence signal and therefore, is confirming the bearish potential. Traders can enter short positions after the price line breaks below the green line, there they can enter short positions heading to the support zone at 1.06800 and 1.05465 after that.
• DISCLAIMER: Please note that the above analysis is not an investment suggestion by “Capitalcore Ltd”. This post has been published only for educational purposes.