AUD/NZD price line in a triangle
AUD/NZD price line has been moving in a triangle pattern since 6th of April 2015 and has not been able to break out of the triangle yet. The price line has made several reactions to both of the resistance and support zones in this triangle. The next several candles are of high value, as they might reveal the direction of the next phase on AUD,NZD price chart.
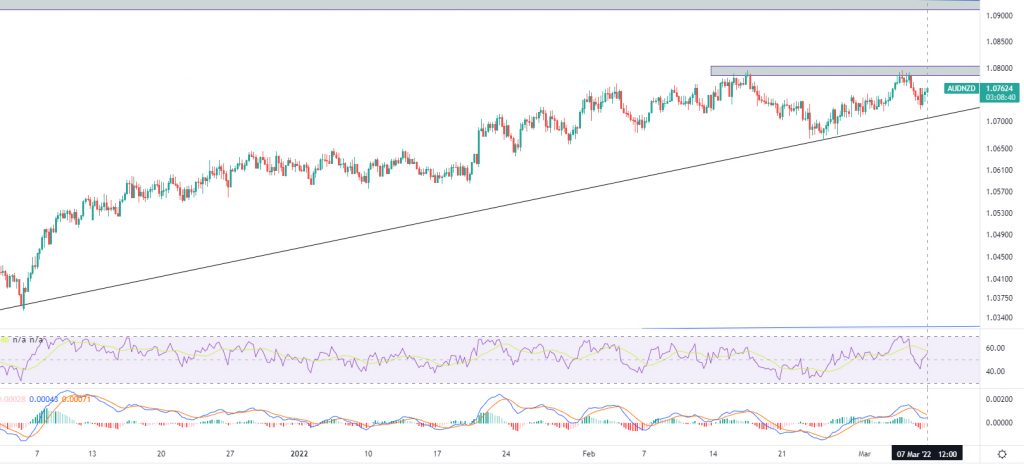
Chart Notes:
• Chart time-zone is UTC (+03:00)
• Candles’ time-frame is 4h.
On 19th of November 2021, after touching the base line of the triangle (dynamic support zone) the price line started an ascending phase, during which a dynamic support zone, with a greater slope was formed; this zone is indicated as a black line on the chart. At the moment, on AUD,NZD price chart, the price line is on 1.07624 and there are two considerable resistance levels above the price line at about 1.08 and 1.1 . The support levels below the price line, far apart the black line on the chart, are lying at 1.03232 and 1.00025 Traders can be waiting for the price line to break above or below any of the closest support or resistance lines and then they can open positions towards the next support or resistance.
• DISCLAIMER: Please note that the above analysis is not an investment suggestion by “Capitalcore Ltd”. This post has been published only for educational purposes.