The price is ready for the next descending wave
The price on AUD/NZD chart has been ascending on a dynamic support line and right now the price has reached to a strong resistance. The next descending wave looks to be close. Different indicators signal for descend and the overall look of the chart is bearish.
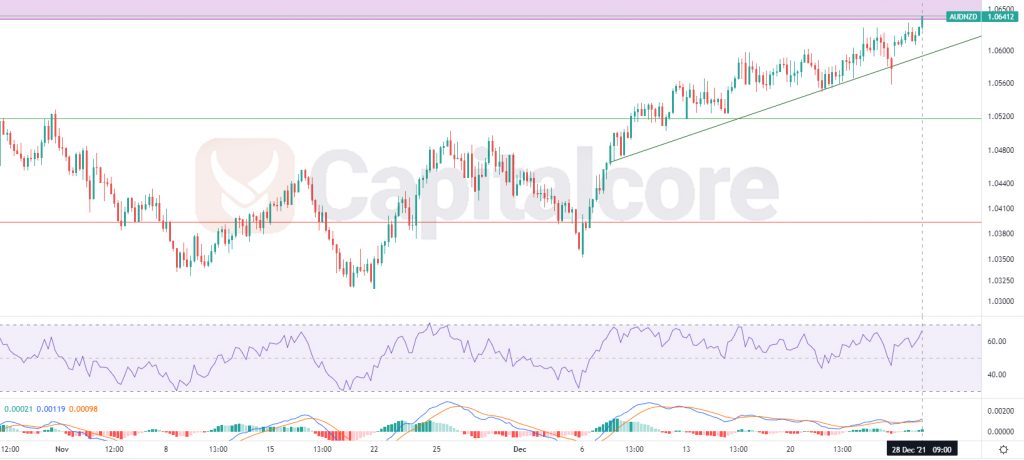
Chart Notes:
• Chart time-zone is UTC (+03:00)
• Candles’ time-frame is 4h.
The price at the moment is on 1.06412 which equals to level 0.382 of the previous ascending wave. The area is considered as a strong resistance as several reactions has been made to this level. The purple area shows the resistance which is not expected to be broken; this area includes 1.0638-1.0662. The dark green line below the price line shows a dynamic resistance that has recently been formed. MACD is showing that the ascending phase is still on going. RSI indicator is showing divergence and is showing almost 66 at the moment. In case the price line breaks below the dynamic support line, sellers can wait for a retest of the purple area, and then they can enter the market. the targets for the descending wave would be 1.0518 and The next target would be 1.03939 . Please consider that breaking above 1.06632 for the price, reduces the chance of descend.
• DISCLAIMER: Please note that the above analysis is not an investment suggestion by “Capitalcore Ltd”. This post has been published only for educational purposes.