AUD is trying to recover the loss against USD
Westpac Leading Index MoM has been released in Australia and the US will publish FOMC Economic Projections and Fed Interest Rate Decision. on the chart, an ascending channel has been formed. The overall look of the chart is bullish and a smooth ascending trend is expected.
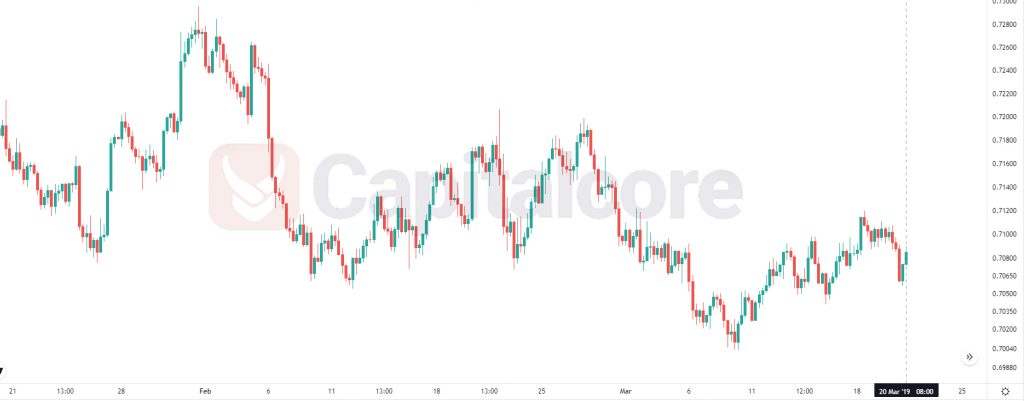
Chart Notes:
• Chart time-zone is UTC (+03:00)
• Candles’ time-frame is 4h.
The support rests at 0.70500 with resistance at 0.71000 which the weekly pivot point at 0.70710 is located in between the lines. The EMA of 10 is moving with bearish bias in the ascendant channel and it is below the EMA of 200 and above the EMA of 100. The RSI is moving on the 50 level, the MACD line is below the signal line in the negative territory and the Stochastic is moving in low ranges. The ADX is not showing any clear signals. The price is in the Ichimoku Cloud and above the Chinkou Span. The Tenkan-sen and the Kijun-sen are both showing a horizontal trend.
The support level breakthrough will smooth the way for further decline towards 0.7029; otherwise, AUDUSD may continue its bullish trend towards 0.71300.
• DISCLAIMER: Please note that the above analysis is not an investment suggestion by “Capitalcore Ltd”. This post has been published only for educational purposes.