An ascending phase is about to begin
AUD/USD started a descending wave on 29th of October 2021 and descended up tp 7.4% until 3rd of December 2021. A descending trendline was formed; this trendline was broken by the price line on 17th of February 2022 and made a retest of this level on 24th of February 2022.
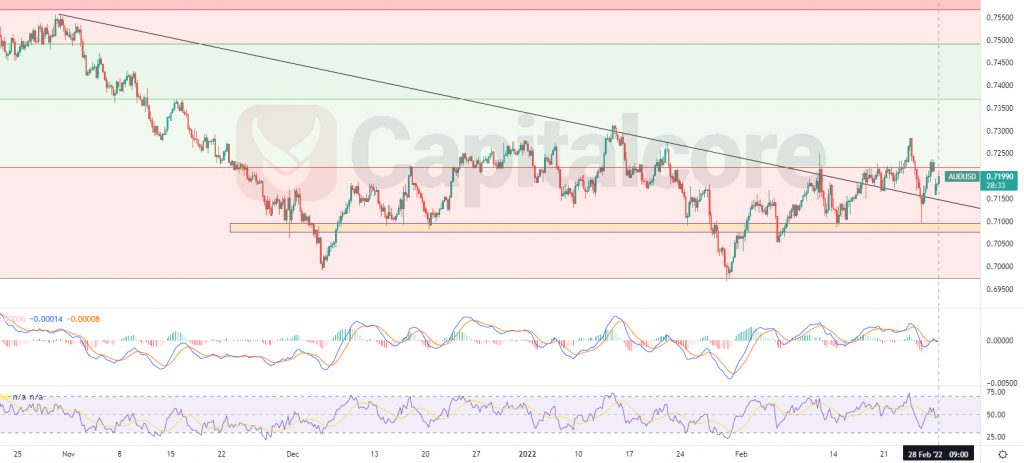
Chart Notes:
• Chart time-zone is UTC (+03:00)
• Candles’ time-frame is 4h.
The price, at the moment on AUD/USD price chart, is on 0.7199, which would be just above the broken resistance level and a little below level 0.236 of the Fibonacci retracement. The yellow zone below the price indicates the static support level below the price line, as it had been able to pump the price several times in the past, it is considered a strong support level. RSI is almost on 50 and MACD shows signals of a potential, sharp ascending wave. Buyers can target 0.73715, if the support zone can pump the price up; the other target that can be considered for the ascending wave, is on 0.75235. Please consider that in case the price breaks below the yellow zone (0.707 – 0.7.0975) the chance for bullish wave to occur would highly reduce.
• DISCLAIMER: Please note that the above analysis is not an investment suggestion by “Capitalcore Ltd”. This post has been published only for educational purposes.