The price line is on a strong resistance
AUD/USD has been moving within a descending trend line since 3rd of June 2022. The price on this pair descended more than 7% until 1st of July 2022, as the result of the descending trend. Right now, after taking a bullish step, the price line is once more ready for another descending wave.
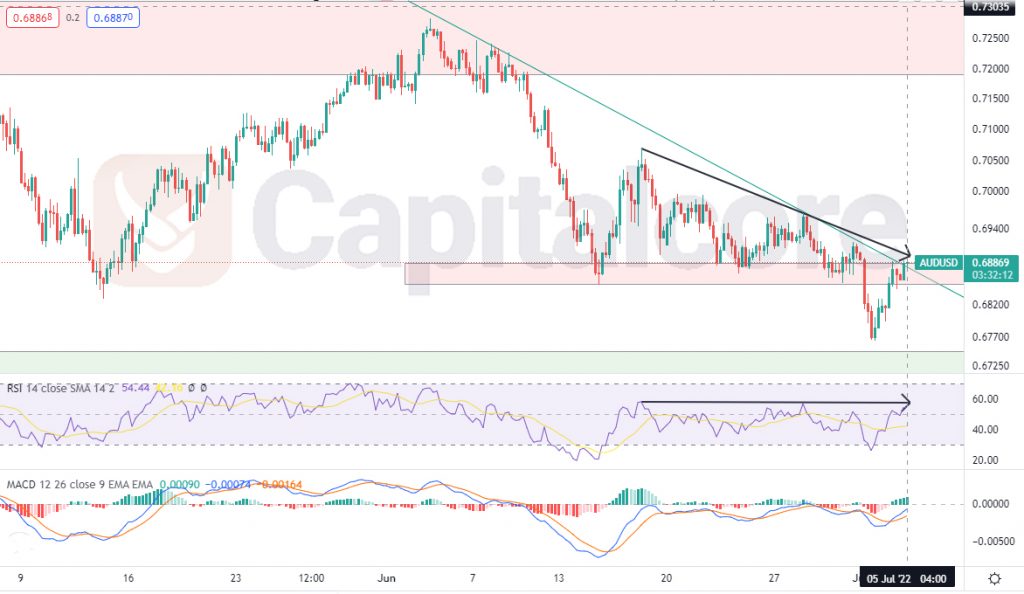
Chart Notes:
• Chart time-zone is UTC (+03:00)
• Candles’ time-frame is 4h.
The price line on AUD/USD price chart is showing 0.68869 at the moment, which would be just above the static resistance level at 0.6884 – 0.68522; the resistance level is reflected as a light red zone just below the price line. The descending green line indicates the dynamic resistance that has formed the current discoing trend; and the green zone below the price line indicates a support level which has been able to pump the price line several times in the past, therefore is considered as a major support zone. RSI is currently above 50 but is issuing negative divergence signal. MACD, how ever, is showing bullish trend, still, on-going. Traders should keep an eye on this pair on shorter time frame and in case they witnessed any bullish trigger, they can enter short positions heading to 0.067777 and 0.66218 after that.
Traders with less risk apatite could wait for the price line to break below the red resistance zone once more, and then they can enter the position.
• DISCLAIMER: Please note that the above analysis is not an investment suggestion by “Capitalcore Ltd”. This post has been published only for educational purposes.