AUD/USD Nears Key Fibonacci Retracement Levels
The AUD/USD forex pair, commonly known as the “Aussie,” is a major currency pair in the foreign exchange market, representing the exchange rate between the Australian dollar and the US dollar. AUDUSD forex pair is highly popular among traders due to its liquidity and the economic relationship between Australia and the United States. As of today, the market is anticipating several significant USD-impacting news events, including the Final Manufacturing PMI, ISM Manufacturing PMI, ISM Manufacturing Prices, Construction Spending, and ECB President Christine Lagarde’s speech. The Final Manufacturing PMI and ISM Manufacturing PMI reports are particularly influential as they provide insights into the health of the US manufacturing sector, with expectations set at 51.7 and 49.2, respectively. If the actual figures exceed these forecasts, it could bolster the US dollar, exerting downward pressure on the AUD/USD pair. Conversely, weaker-than-expected results might support the Australian dollar. Additionally, ISM Manufacturing Prices, forecasted at 55.8, will be closely watched as an indicator of inflationary pressures. ECB President Lagarde’s comments could also add volatility, depending on her stance on monetary policy.
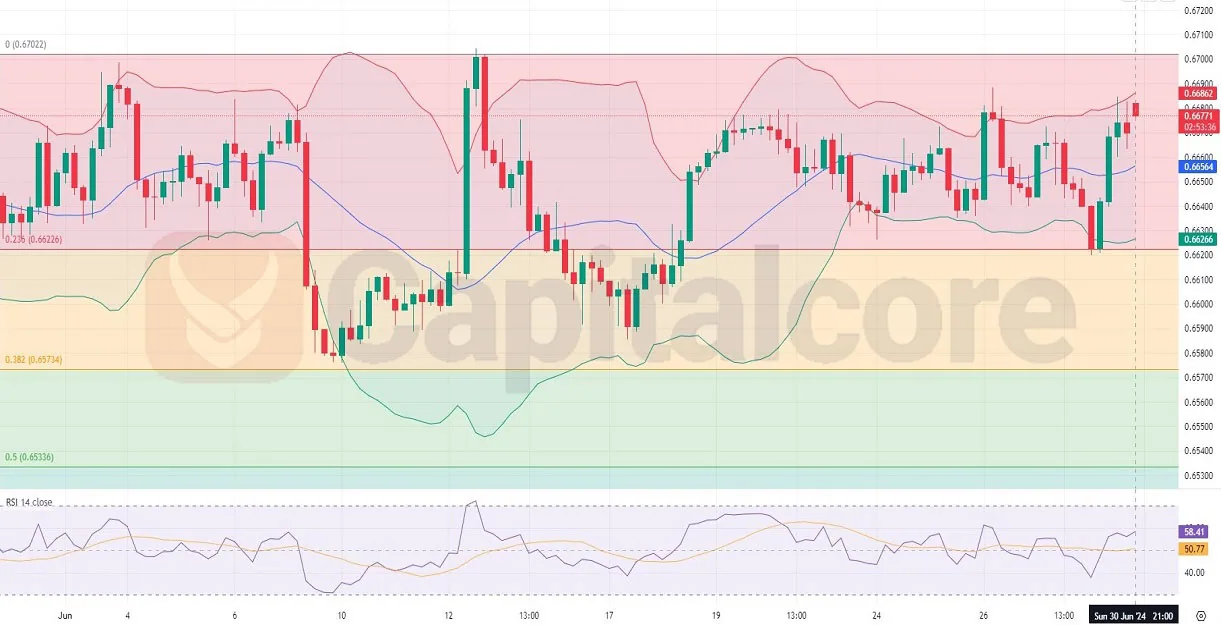
Chart Notes:
• Chart time-zone is UTC (+03:00)
• Candles’ time-frame is 4h.
Analyzing the AUD/USD H4 chart, we observe that the price has been oscillating within the Bollinger Bands. Recently, the price moved from the lower band towards the middle band, reaching the upper band with three consecutive bullish candles. However, the last two candles have been bearish, indicating a potential correction but still hovering near the upper band, suggesting ongoing bullish momentum. The Bollinger Bands have widened, reflecting increased volatility. Additionally, the AUDUSD price is moving within the Fibonacci retracement levels of 0 and 0.236, indicating potential support and resistance areas. The RSI indicator is approaching overbought territory, which could imply a short-term pullback or consolidation.
• DISCLAIMER: Please note that the above analysis is not an investment suggestion by “Capitalcore Ltd”. This post has been published only for educational purposes.