- June 2, 2020
- Category: Market News
Bulls over passed all the resistances
Company Operating Profits, Current Account and RBA Interest Rate Decision were published in Australia. On the chart, AUD/USD price could break above the dynamic resistance. Bulls are controlling the market and ascending wave is expected.
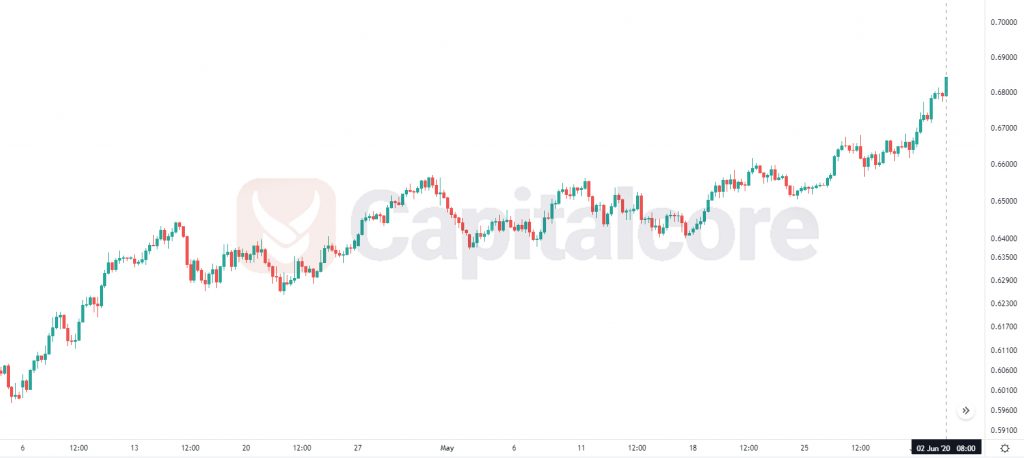
Chart Notes:
• Chart time-zone is UTC (+03:00)
• Candles’ time-frame is 4h.
The support rests at 0.67500 with resistance at 0.68510 which both lines are above the weekly pivot point at 0.66240. The EMA of 10 is moving with bullish bias in the ascendant channel and it is above the EMA of 200 and the EMA of 100. The RSI is moving in overbought area, the MACD line is above the signal line in the positive territory and the Stochastic is moving in high ranges. The ADX is showing buy signal. The price is above the Ichimoku Cloud and the Chinkou Span. The Tenkan-sen and the Kijun-sen are both showing an upward trend.
Long positions are recommended towards 0.69000.
• DISCLAIMER: Please note that the above analysis is not an investment suggestion by “Capitalcore Ltd”. This post has been published only for educational purposes.