The next ascending leg looks to be close
After a significant fall, which started on 19th of October 2021 and finished on 3rd of December 2021, the price line is now ascending within a channel. Several reactions has been made to the mod, top and bottom lane of the channel but the channel is nor broken to either sides yet.
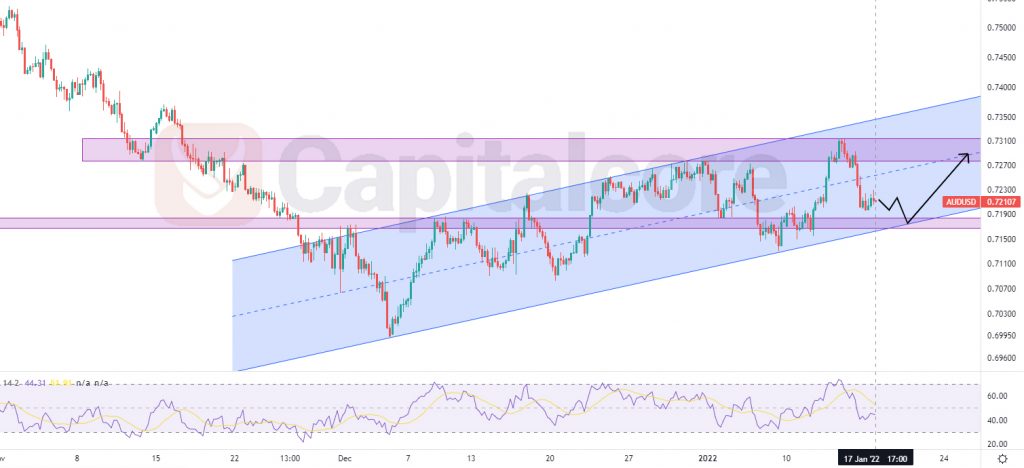
Chart Notes:
• Chart time-zone is UTC (+03:00)
• Candles’ time-frame is 4h.
The price at the moment is on 0.72107. There is a support level below the price line on 0.71676- 0.71841 ; this area is colored purple on the chart. The resistance level is also colored in purple and lays on 0.72775 – 0.73145. RSI is showing almost 45 and has just broken below 50. The overall look of the chart is bullish and traders can be waiting for the price line to touch the support area and in case the area is not broken, they can enter their positions. The target for the ascending wave could be considered in the resistance area that has been shown on the chart, within which, traders can consider different TPs within the resistance.
• DISCLAIMER: Please note that the above analysis is not an investment suggestion by “Capitalcore Ltd”. This post has been published only for educational purposes.