AUD/USD is trending downward sharply, and this trend does not look to be stopping
Unemployment Rate, Employment Change and RBA Interest Rate Decision has been released in Australia and the US will publish Philadelphia Fed Manufacturing Index and Unemployment Claims; none of which was able to rescue the AUD/USD price chart from a free fall. In the following there is a short overview of what AUD/USD has been through.
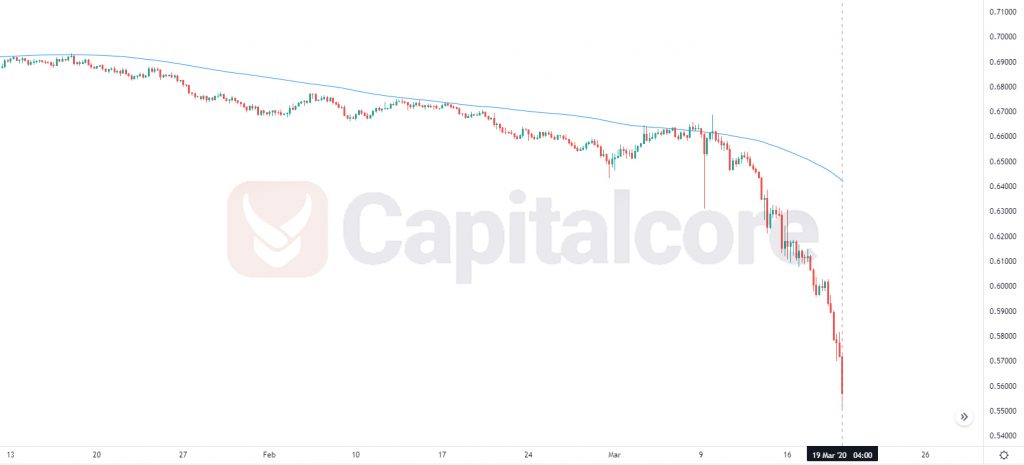
Chart Notes:
• Chart time-zone is UTC (+03:00)
• Candles’ time-frame is 4h.
The support rests at 0.55390 with resistance at 0.58170 which both lines are below the weekly pivot point at 0.63290. The EMA of 10 is moving with bearish bias in the descendant channel and it is below the EMA of 200 and the EMA of 100. The RSI is moving in oversold area, the MACD line is below the signal line in the negative territory and the Stochastic is moving in low ranges. The ADX is showing sell signal. The price is below the Ichimoku Cloud and above the Chinkou Span. The Tenkan-sen and the Kijun-sen are both showing a horizontal trend.
Short positions are recommended towards 0.54900.
• DISCLAIMER: Please note that the above analysis is not an investment suggestion by “Capitalcore Ltd”. This post has been published only for educational purposes.