the price is getting ready fore a big move.
After a strong bullish move towards 0.6929 AUD/USD started a smooth bearish move but each time the price tried to descend below 0.677 a support level at about 0.675 . 0.677 pumped price up. also a dynamic resistance level that started shaping a few days ago, which the price has not be able to across yet. Junction of the support and resistance level has formed a bearish triangle. As each ascending wave couldn’t overpass the previous one, the prices seems to be tending to form a bearish move; how ever there are some other possibilities too.
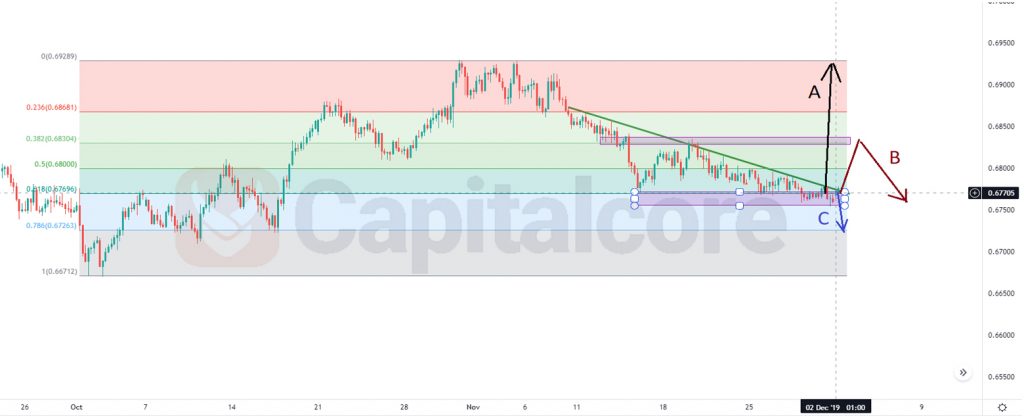
Chart Notes:
• Chart time-zone is UTC (+03:00)
• Candles’ time-frame is 4h.
So based on what we can see on the chart, there are three possible outcomes for AUD/USD chart in the next few days:
• A: a strong out break from the descending trendline may be a good sign of a strong bullish move towards the next static resistance, which be at 0.692 – 0.693, a retest of the descending resistance is highly possible after out breaking the price.
• B: this theory again shapes after out break of the trendline. if the price rises to the 0.382 level of Fibonacci which will be around 0.683 and in the 0.683 – 0.684 area we could see any sign of a trend reversal, we can expect the price to retest the current support level.
• C: if the current support level cant hold the price, the next price we should be expecting to be the target of the current descending trend, will be at about 0.6725 which is a strong support level and also 0.786 level of Fibonacci retracement.
• DISCLAIMER: Please note that the above analysis is not an investment suggestion by “Capitalcore Ltd”. This post has been published only for educational purposes.