The price line is about to enter a new trend
The AUDUSD pair consolidates above the 0.7125 level and continues to produce bullish trades to initially test the 0.7205 level, with a break of this level pushing the price to 0.7275 as a next positive objective. The next few candles would be of high value tp predict the next move.
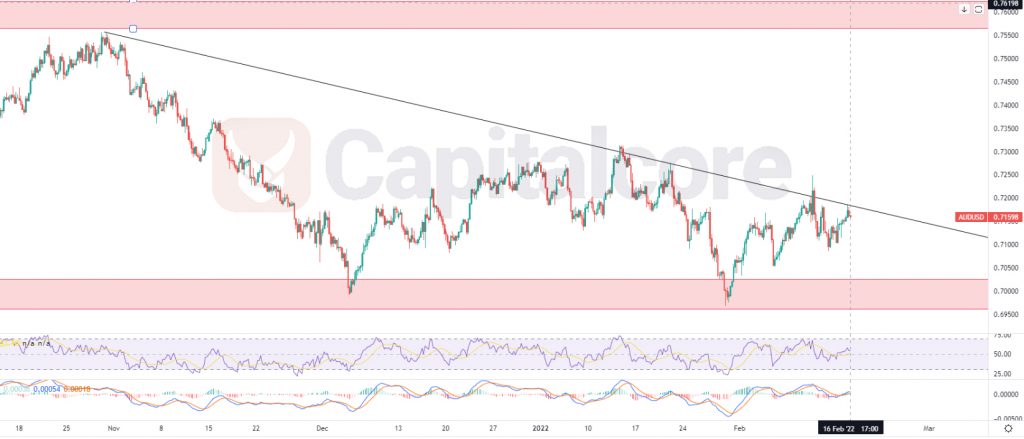
Chart Notes:
• Chart time-zone is UTC (+03:00)
• Candles’ time-frame is 4h.
The red zone below the price line indicates a support level which lays on 0.696 – 0.7025. The black line indicates the dynamic resistance level and the red zone above the price line shows a static resistance level which lays on 0.755 – 0.763. RSI is on 55 and MACD is showing weakness in ascending phase. In case the price line breaks above the dynamic resistance, traders can be waiting for a retest on this area and then they can enter long position; the possible targets for the ascending wave could be considered on 0.7315 and if the bulls are powerful enough, the price line can also reach out to the red zone. Please consider that in case the price line breaks below the red support zone, the theory would be invalidated.
• DISCLAIMER: Please note that the above analysis is not an investment suggestion by “Capitalcore Ltd”. This post has been published only for educational purposes.