A bullish wave looks to be coming
On AUD/USD price chart, the price line formed a descending triangle after going through a strong descending wave; and after making several reaction to the top and bottom line of the triangle, the price line has reached to a strong support zone, while maintaining inside the triangle.
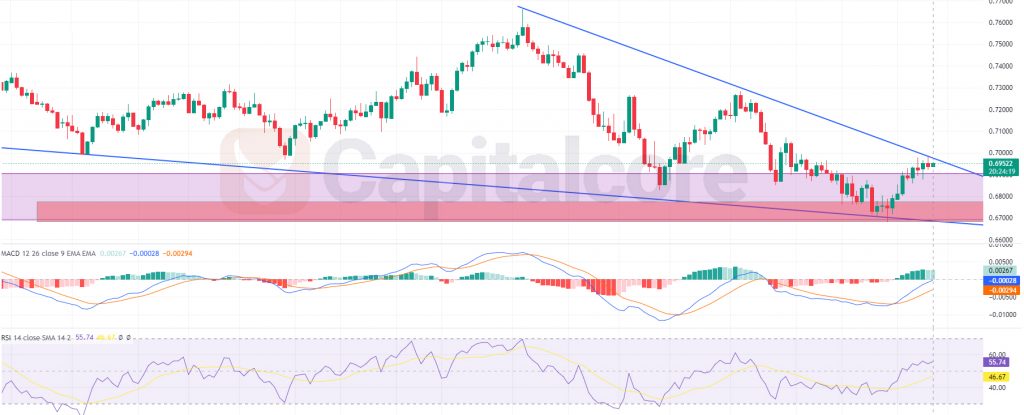
Chart Notes:
• Chart time-zone is UTC (+03:00)
• Candles’ time-frame is daily.
The price line is currently indicating 0.69522, this area is located just above the static support zone and below the dynamic resistance on the descending triangle. The static demand zone is considered valid as it has been able to pump the price line several times, the dynamic supply level, however, has currently formed and has recorded only two reactions by the price line. RSI Is above 50, and is showing almost 56. The dynamic resistance level of the descending triangle, shown as a blue line above the price line, has not yet been broken and is still valid. The purple zone on the chart indicates a strong support zone on weakly timeframe and the red zone, indicates a potential nested zone which has been formed currently. Traders can be waiting for the price line to touch the nested zone once more, there they can enter long positions heading to 0.7245 and 0.75375 after that. Buyers with less risk appetite, can be waiting for the price line to break above the dynamic resistance and then they can enter long positions on the retest of the resistance line.
• DISCLAIMER: Please note that the above analysis is not an investment suggestion by “Capitalcore Ltd”. This post has been published only for educational purposes.