A strong wave is about to take place in the chart
It seems that the Australian Dollar breakout above the resistance. But today market behavior depends on the long term traders’ reaction. What economic news shows is a temporarily rising inflation since all the increases were centered in areas effected due to the pandemic.
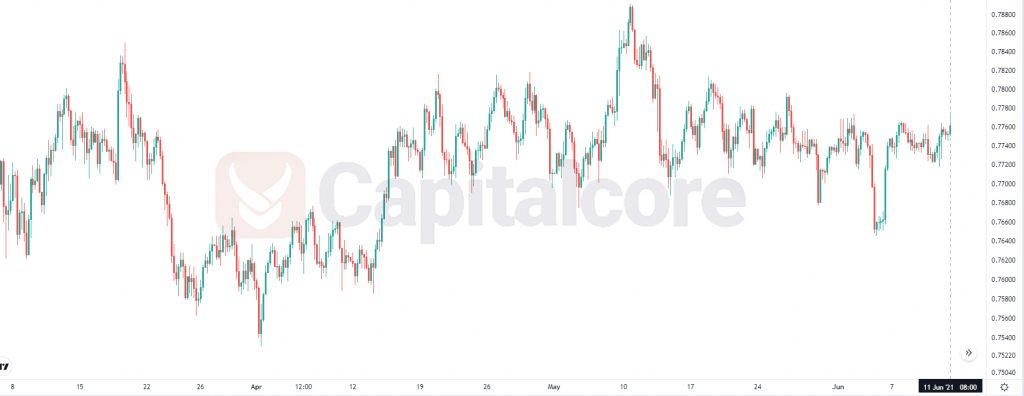
Chart Notes:
• Chart time-zone is UTC (+03:00)
• Candles’ time-frame is 4h.
The support rests at 0.77470 with resistance at 0.77560 which the Pivot Point at 0.77510 is located below the price line. The EMA of 10 is moving in slight bullish bias above the EMA of 100 and EMA of 200. The EMA100 and 200 reached to the same point and moving horizontally. The RSI is going toward the level of 70, the MACD histogram is in positive territory with a horizontal signal. The Stochastic is moving in high ranges and the ADX is not showing a clear signal. The price is above the Ichimoku Cloud and the Chinkou Span is near to the market price. The Tenkan-sen and the Kijun-sen are reaching to the same point.
• There is resistance at 0.77560, followed by resistance at 0.77600 and 0.77650.
• There is support at 0.77470 Below, there is 0.77420 and 0.77380.
• DISCLAIMER: Please note that the above analysis is not an investment suggestion by “Capitalcore Ltd”. This post has been published only for educational purposes.