The support level looks too fragile to hold the price
Facing a fall on Wednesday, the Australian Dollar is acting lower this Friday. There is the sign of a sharp pullback after a week with strong gains. the overall look of the chart is bearish but the current level of the price is supported by bulls strongly, as we can see on the chart, the price was pumped up from this level several times before, this may happen this time too.
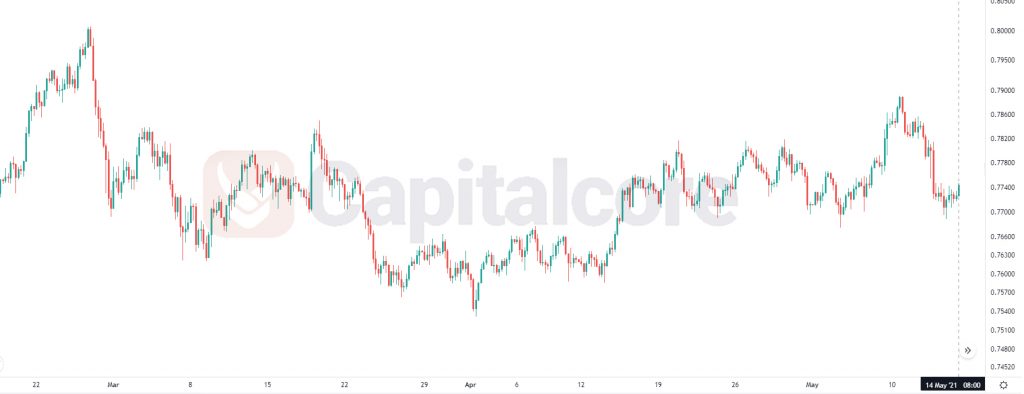
Chart Notes:
• Chart time-zone is UTC (+03:00)
• Candles’ time-frame is 4h.
The support rests at 0.77180 with resistance at 0.77340 which the Pivot Point at 0.77260 is located below the price line. The EMA of 10 is moving in bearish bias in descendant channel and it crossed EMA of 200 and below the EMA of 100. The RSI is moving in oversold area, the MACD histogram is in negative territory and is going to generate a crossover buy signal. The Stochastic is moving in high ranges and the ADX is moving horizontally. The price is below the Ichimoku Cloud and the Chinkou Span is near to the market price. The Tenkan-sen is showing a downtrend momentum and the Kijun-sen is moving horizontally.
• There is resistance at 0.77340 , followed by resistance at 0.77420 and 0.77500.
• There is support at 0.77180 Below, there is 0.77100 and 0.7702.
• DISCLAIMER: Please note that the above analysis is not an investment suggestion by “Capitalcore Ltd”. This post has been published only for educational purposes.