Volatility and Bearish Signals in AUDCHF: An H4 Chart Review
The AUDCHF forex pair, also known as the “Aussie-Swiss,” represents the exchange rate between the Australian Dollar (AUD) and the Swiss Franc (CHF). This pair combines the high-yielding Australian Dollar with the safe-haven Swiss Franc, making it sensitive to both risk sentiment and economic data from Australia and Switzerland. Given the mixed nature of these currencies, trading the AUDCHF can provide opportunities during various market conditions.
Today’s key economic releases include the Australian Producer Price Index (PPI) for Q2, which is expected to show a 1.0% increase. A higher-than-forecast PPI would indicate rising costs for producers, which could lead to increased consumer inflation and potentially support the AUD. On the Swiss side, the Consumer Price Index (CPI) for July is anticipated to drop by 0.2%. A lower CPI would suggest decreasing inflationary pressures, possibly leading to a dovish stance by the Swiss National Bank (SNB). Additionally, the Swiss Manufacturing PMI is forecasted at 44.4, indicating potential contraction in the sector. These data points are likely to influence the AUDCHF pair, with the Australian data possibly providing support for the AUD, while weaker Swiss data might weigh on the CHF.
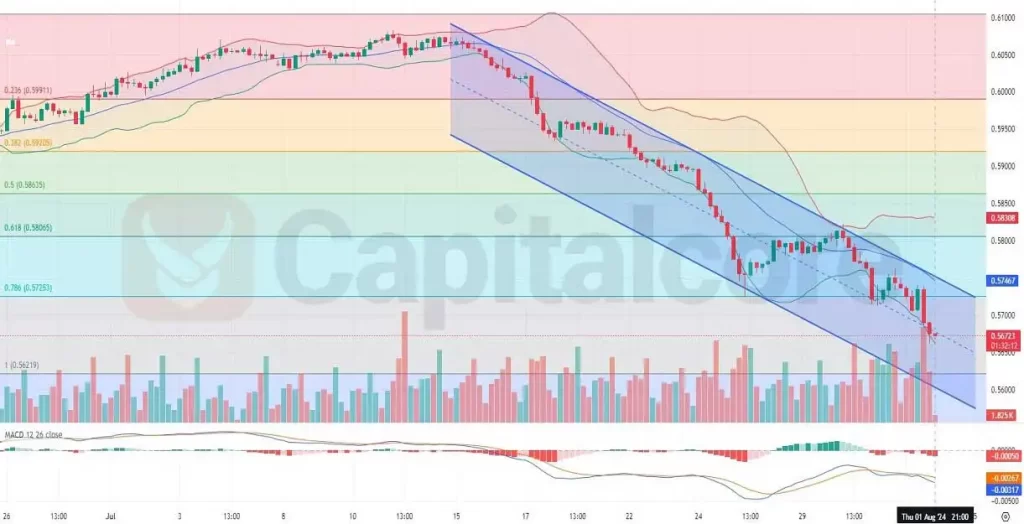
Chart Notes:
• Chart time-zone is UTC (+03:00)
• Candles’ time-frame is 4h.
The AUDCHF H4 chart shows a strong bearish trend, with the price consistently forming negative candles and moving near the lower Bollinger Band, indicating sustained selling pressure. The Bollinger Bands are widening, which suggests increased volatility, but the overall trend remains bearish. The MACD indicator is showing bearish signals, with both the MACD line and the signal line positioned below the zero line, and the histogram also negative, reinforcing the downtrend. The price is currently between the 1 and 0.786 Fibonacci retracement levels, highlighting a significant downward move from its recent highs.
• DISCLAIMER: Please note that the above analysis is not an investment suggestion by “Capitalcore LLC”. This post has been published only for educational purposes.