AUDUSD and Key Levels to Watch for a Breakout
The AUD/USD currency pair, often referred to by traders as the “Aussie,” is a major forex pair representing the exchange rate between the Australian dollar and the US dollar. This pair is heavily influenced by the economic policies and conditions in both Australia and the United States, making it a favorite among forex traders looking to capitalize on macroeconomic trends and news releases.
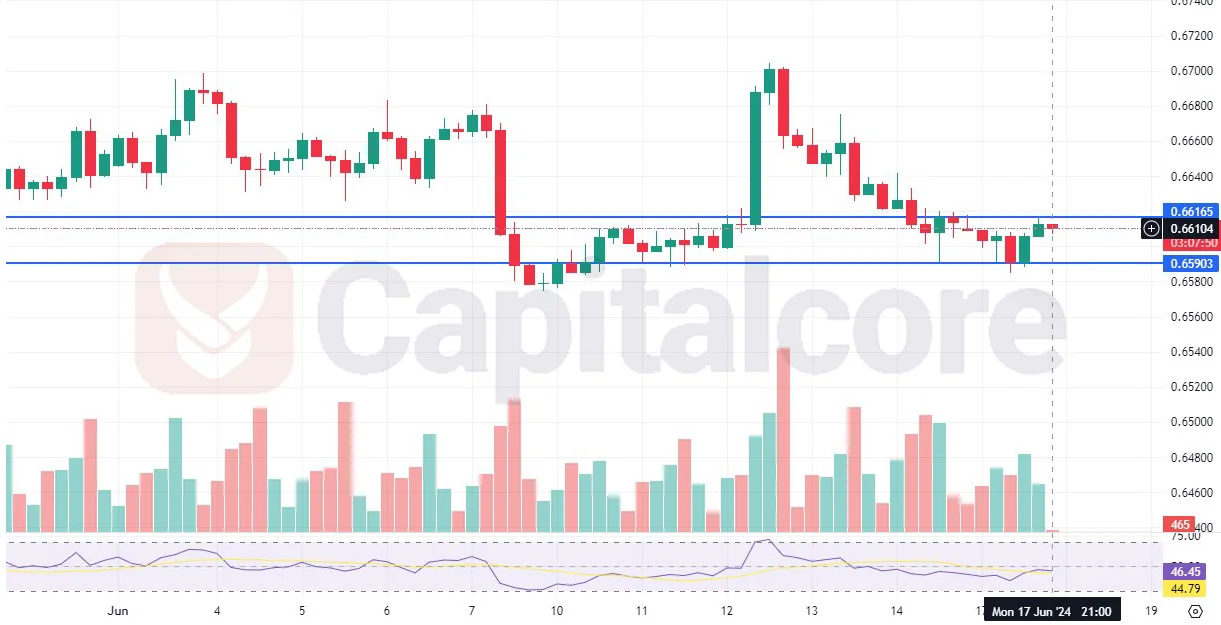
Chart Notes:
• Chart time-zone is UTC (+03:00)
• Candles’ time-frame is 4h.
Based on the provided H4 chart and the recent news releases, there is an observable general bearish trend for the AUD/USD. However, recent price action suggests a potential shift towards a bullish trend, presenting a buying opportunity for traders. The support level at approximately 0.65903 has been tested multiple times, indicating a strong base, while the resistance level at 0.66165 is being approached again. This suggests that if the price breaks above this resistance, there could be a significant upward movement. In the context of AUDUSD analysis today, the recent Reserve Bank of Australia’s hawkish outlook and the Federal Reserve’s resource utilization data could further impact the pair’s movement, providing traders with opportunities to capitalize on these economic indicators. This detailed AUDUSD technical analysis today highlights the crucial levels and potential breakout points that traders should watch for, reinforcing the importance of staying updated with AUDUSD forecast live for informed trading decisions.
• DISCLAIMER: Please note that the above analysis is not an investment suggestion by “Capitalcore Ltd”. This post has been published only for educational purposes.