- November 11, 2021
- Category: Market News
A sharp move is about to occur
AUD/USD had been through a strong ascending wave and then started to form a descending wave within a channel. The channel has not been broken to either sides yet and right now the price is on the mid line of the channel and a short term descending trend line has formed.
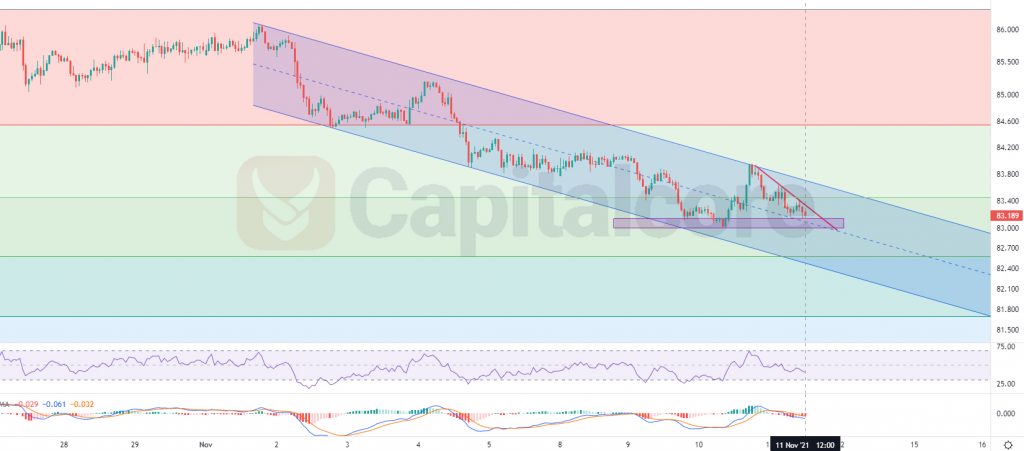
Chart Notes:
• Chart time-zone is UTC (+03:00)
• Candles’ time-frame is 1h.
The price line has broken below level 0.328 of the Fibonacci retracement on the previous ascending leg. The price line is Now reacting to the mid line of the channel. There is also a static support level below the price line at 83 – 83.14 . RSI indicator The area is of high value for AUD/JPY is showing 40(almost) and MACD is showing re-strengthening of the descending wave. In case the support area can hold the price once more, and pump the price above the red trend line, buyers can expect to see the price line on 84.5. Sellers can enter the market if the price breaks below the support area and can target 82.5 and 81.9 for the TP.
• DISCLAIMER: Please note that the above analysis is not an investment suggestion by “Capitalcore Ltd”. This post has been published only for educational purposes.