- March 21, 2022
- Category: Market News
The resistance level has resisted once more
The price line started an ascending wave on 28th of January 2022 and could ascend to 0.74412 on 7th of March 2022; the price line then descended to a support level and once more ascended to the resistance level. It looks as if the resistance has been able to dump the price line again.
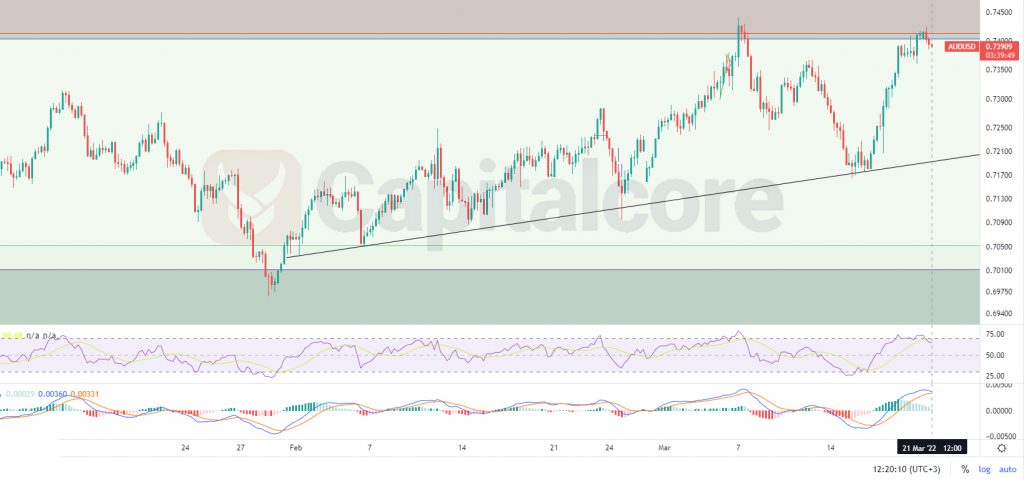
Chart Notes:
• Chart time-zone is UTC (+03:00)
• Candles’ time-frame is 4h.
The price line at the moment is showing 0.73909 at the moment which would be just below the resistance level, which is shown as a red zone. The black ascending line indicates the dynamic support which has been formed by the formation of the ascending phase. The dark line on the lower part of the chart, indicates the support zone which is considered a strong one. RSI is almost on 67 and MACD is showing weakness in the ascending wave. Traders can be waiting for the price line to have a retest of the resistance zone and then they can enter short positions. The target for the descending wave could be considered on the dynamic black line and then 0.705. Note that, in case the price line breaks above 0.748, the chance of occurring for the mentioned descending wave would highly reduce.
• DISCLAIMER: Please note that the above analysis is not an investment suggestion by “Capitalcore Ltd”. This post has been published only for educational purposes.